The Survey Raw Data dashboard in QEval offers a comprehensive, drill-down view of every individual survey response before the data is aggregated into analytics or reports. It provides the most granular level of survey information, enabling users to monitor performance, pinpoint areas for improvement, and export raw data for further reporting and analysis.
The Survey Raw Data section provides a detailed record of every submitted survey response. By default, the view displays data for the last 30 days, ensuring users always see the most recent feedback.
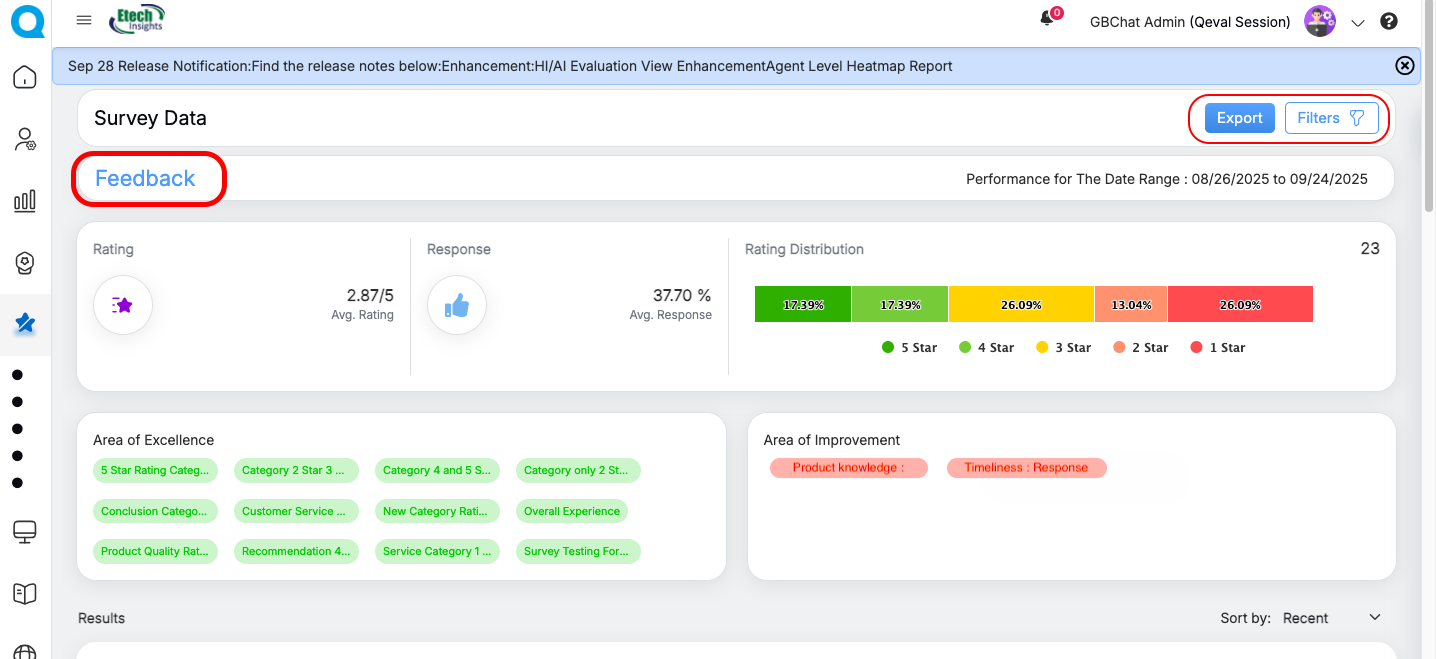
Feedback Insights
The Feedback Dashboard within Raw Data gives a quick snapshot of performance trends and highlights areas that matter most:
-
Average Rating – Displays the cumulative survey score (e.g., 2.87/5).
-
Average Response % – Indicates the participation rate for surveys.
-
Rating Distribution – A visual chart showing the spread of 5-star, 4-star, 3-star, 2-star, and 1-star responses.
-
Area of Excellence – Lists the categories or parameters where agents/programs have performed exceptionally well.
-
Area of Improvement – Identifies categories flagged for enhancement (only shown when applicable).
This section allows users to quickly identify strengths, track gaps, and monitor rating patterns over time.
Survey Results – Data Elements Displayed
Each survey response entry includes the following details:
-
Agent Name – The agent associated with the survey response.
-
Customer Name – The customer who submitted the survey.
-
Program / Brand Name – The program under which the survey was conducted.
-
Channel – The distribution method used (SMS or Email).
-
Star Rating & Review – The overall rating given along with customer feedback comments.
-
Tags – Labels applied to categorize or highlight key aspects of the feedback.
-
Survey Timestamp – The exact date and time when the survey was submitted.
-
Category Scores – Ratings assigned to individual survey categories for deeper analysis.
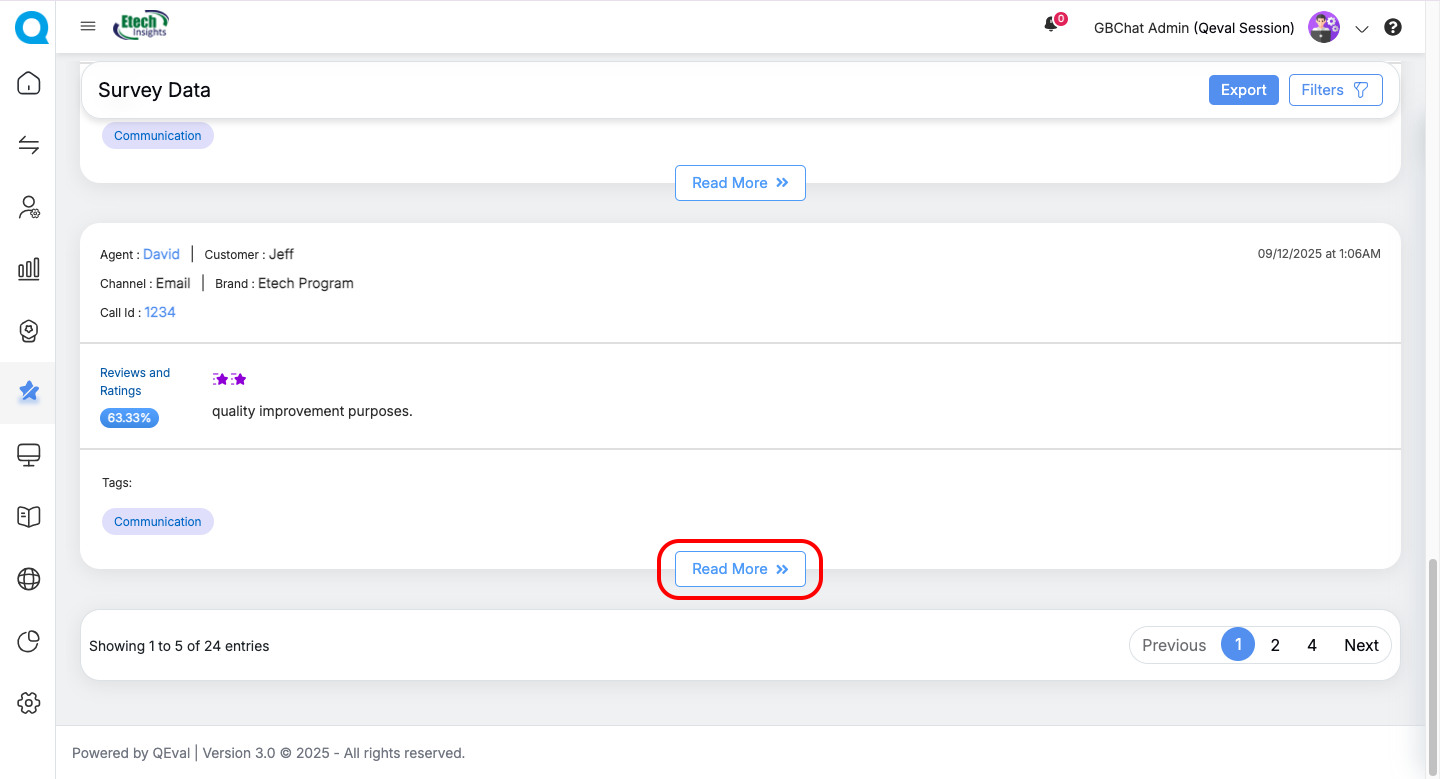 Read More – Clicking this option opens the full survey, displaying all questions, responses, and category-level scoring.
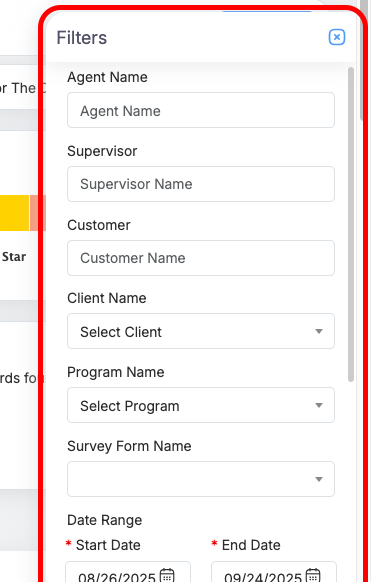
Filter options
The Filter Panel allows users to refine the dataset. Available filters include:
-
Agent Name
-
Supervisor Name
-
Customer Name
-
Client Name
-
Program Name
-
Survey Form Name
-
Date Range (default = last 30 days)
-
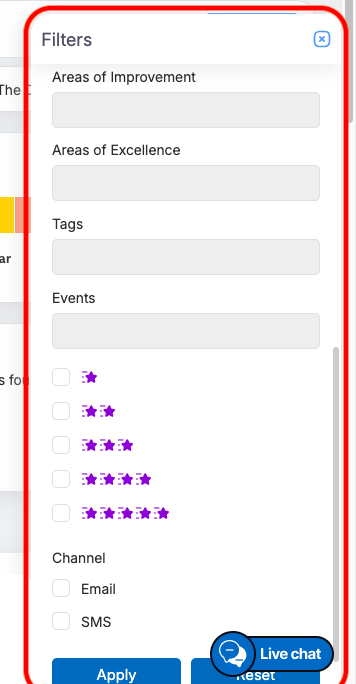
Areas of Excellence / Improvement
-
Tags
-
Events
-
Rating (1–5 stars)
-
Channel (Email / SMS)
Users can:
-
Apply Filters → Narrow down survey data to the desired scope.
-
Reset Filters → Restore the default view (last 30 days).
Exporting Data
Survey responses can be exported in raw data format directly from the Export option available on the top of the page.
-
Exported files include all survey details, including scorable elements where values are accurately captured for each question.
-
This allows offline analysis and integration with external BI or reporting tools.
Key Benefits of Survey Raw data dashboard
-
Full Visibility → Access detailed customer feedback at both individual and aggregated levels.
-
Data-Driven Insights → Identify top-performing areas and gaps requiring improvement.
-
Flexible Filtering → Easily narrow down results by specific agents, programs, or time periods.
-
Export Capability → Seamlessly download data for advanced analysis or record-keeping.
With this module, users can move beyond averages and view real, detailed feedback, enabling smarter decisions and actionable insights.
Video