A QA Verifier in the QEval environment has the authority to evaluate the performance made by agents.
Dashboard
The QA Verifier console includes operational tabs like – Home, Quality, Coaching, My Universe.
Note: The above-mentioned tabs are based on access rights. Admin can assign separate rights to the individual users. To know about the access rights of the QA Verifier, refer to Users Access Control.
QA Verifier Home Page
QA Verifier will have access to six main tabs on the home page:
- Dashboard
- Disputed Evaluations
- Active User Dashboard
Dashboard
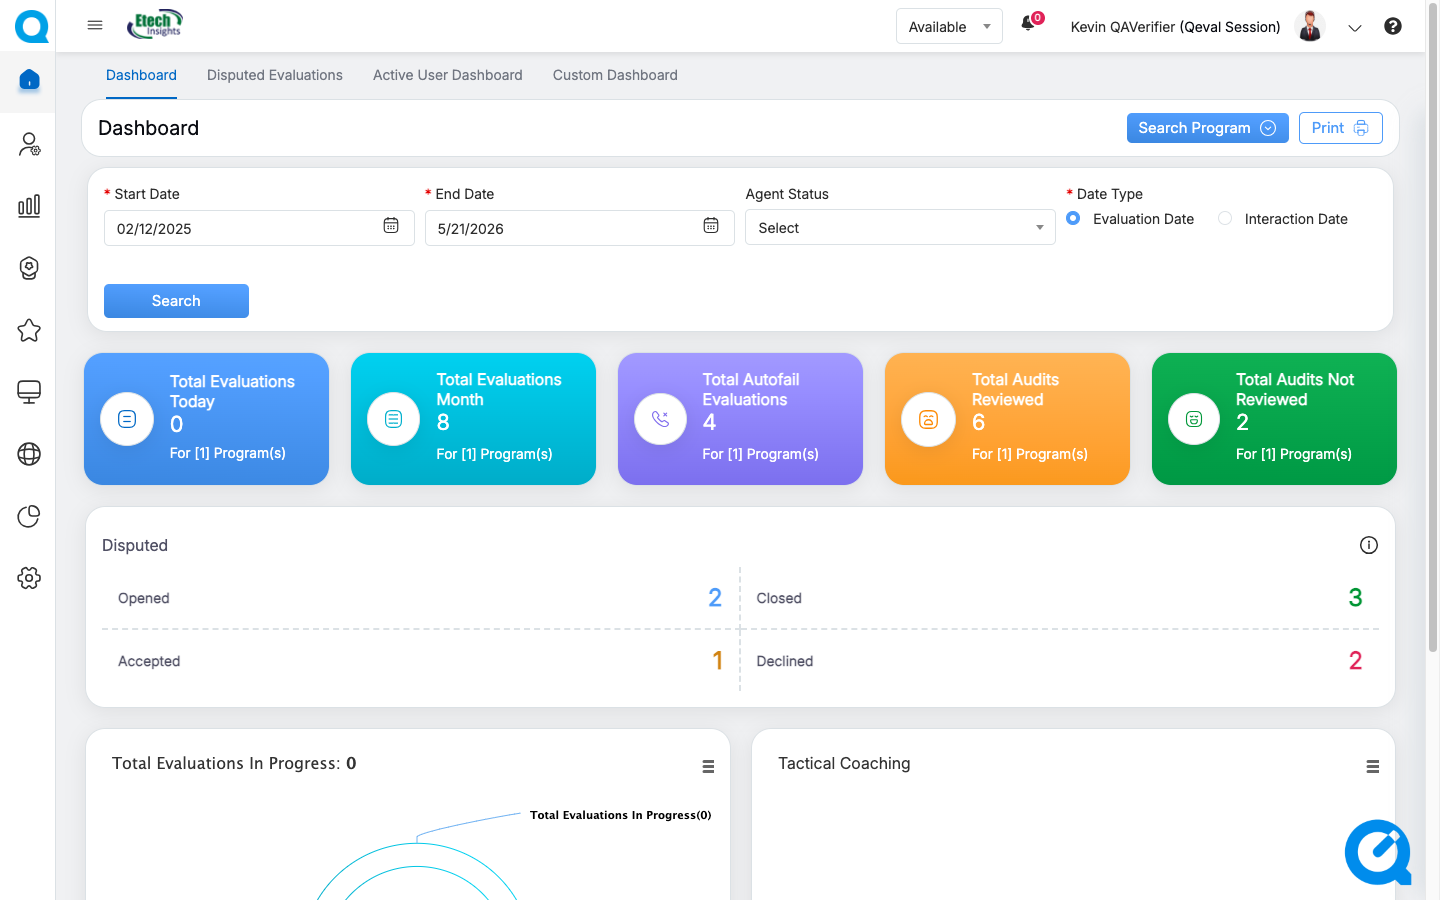
Once the QA Verifier logs in, the Dashboard will be displayed as shown below:
Various analytical data will be displayed. Scroll down to view more and different statistics based on different factors.
Dashboard
The graphical representation of data will be displayed in the form of a Doughnut Chart.
In order to generate any specific data in the Dashboard, QA Verifier needs to set the search filter. To do so, click on the Search Program button as shown below:
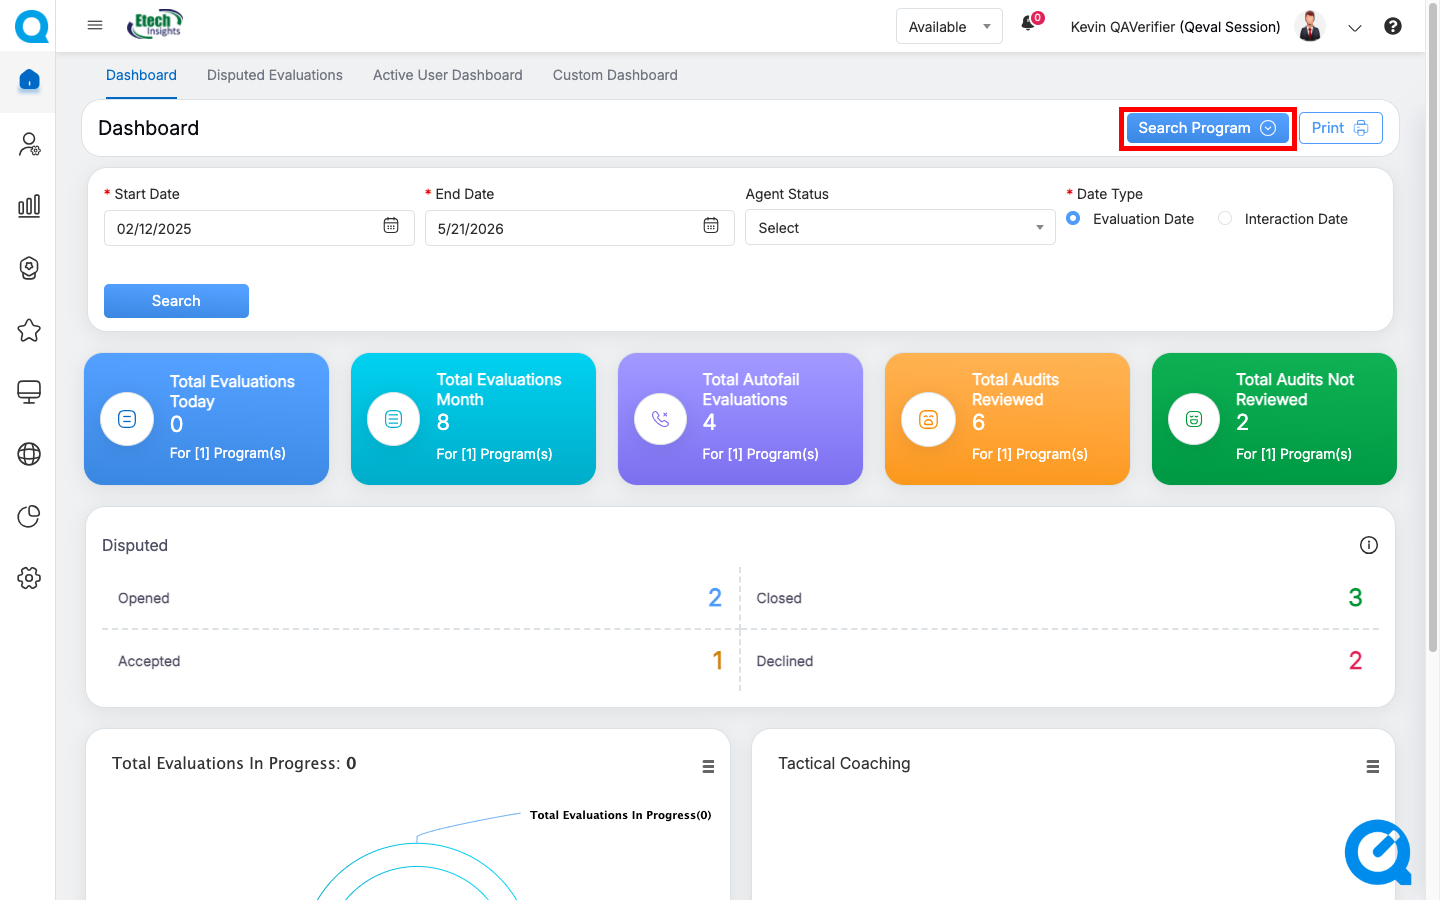
Dashboard
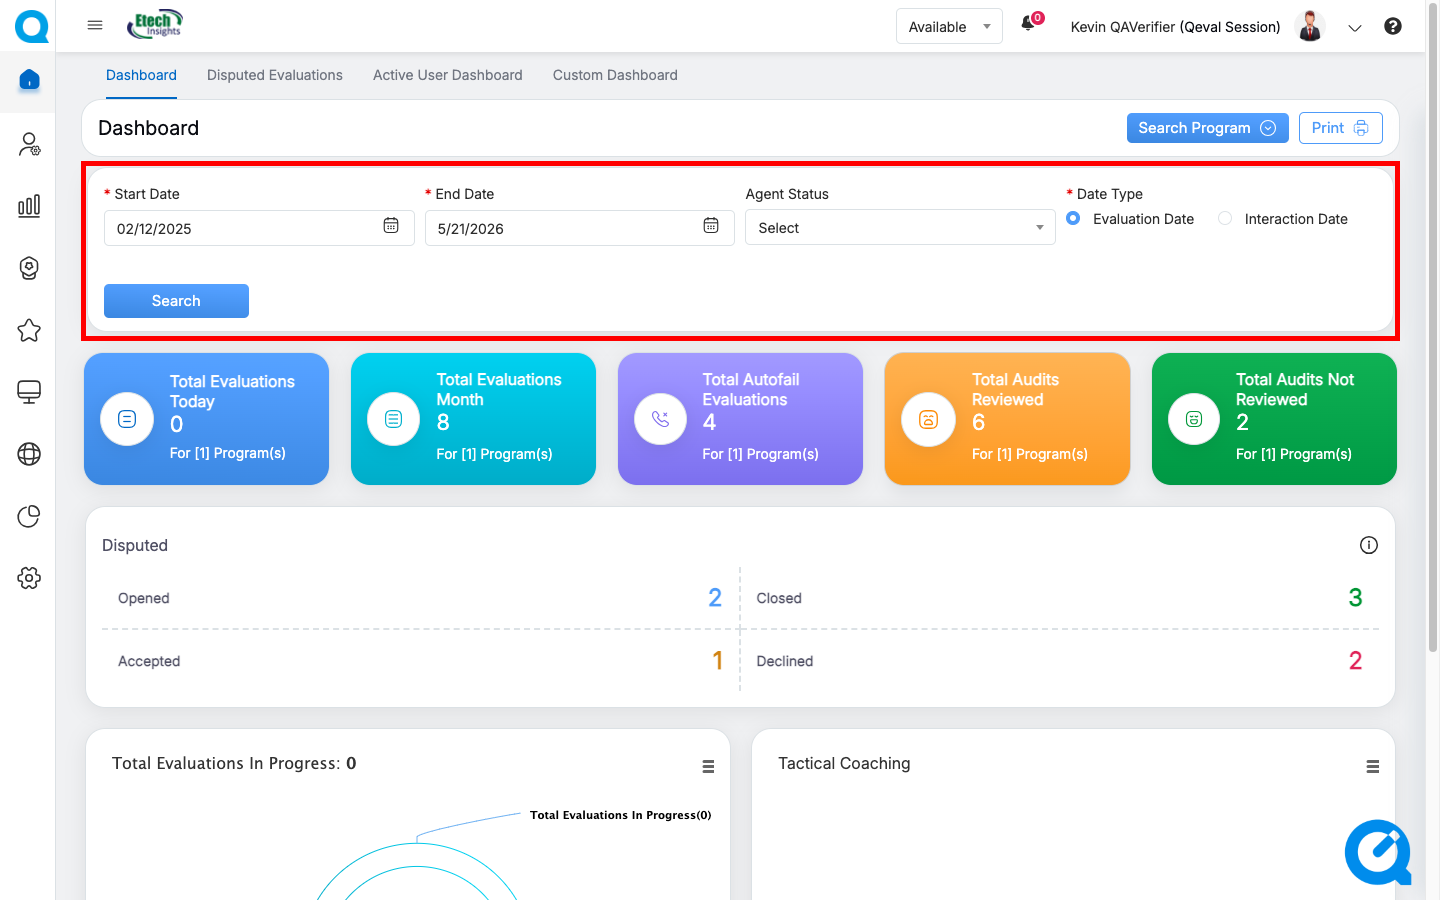
The data will be displayed accordingly.
The following information will be displayed on this page:
|
Dashboard Elements |
Description |
|
Total Evaluation Today |
Displays the total evaluation for the current day. |
|
Total Evaluation Month |
Displays the total evaluation for the current month. |
|
Total Autofail Evaluation |
Displays the agents’ evaluation considering autofail entries for the specified date range. |
|
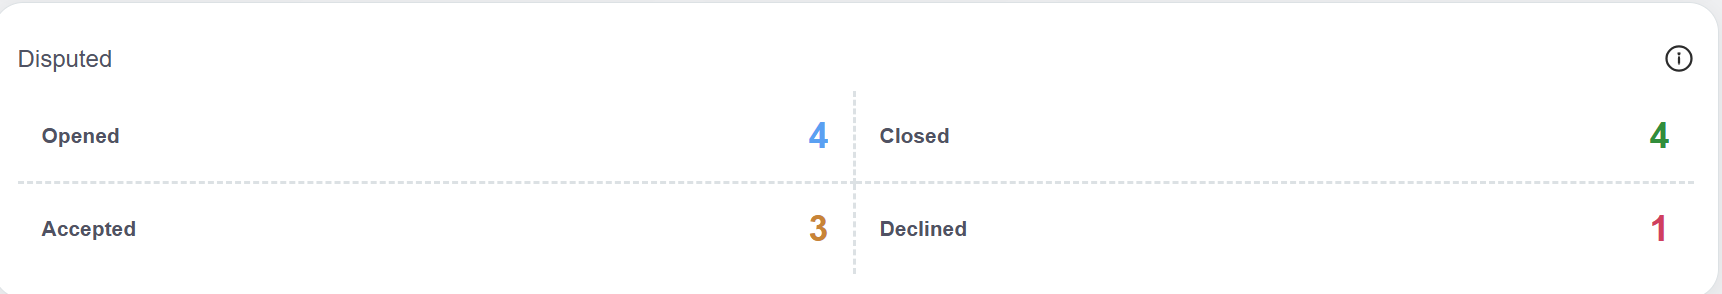
Disputed evaluation summary |
Displays the total number of disputes in the following states:
|
|
Total Audit Reviewed |
Displays the total number of audits that have been reviewed within the specified date range. |
|
Total audit not reviewed |
Displays the total number of audits that have not been reviewed within the specified date range. |
|
Total evaluation in progress |
Displays the total number of Evaluations that are in the In Progress state within the specified date range. |
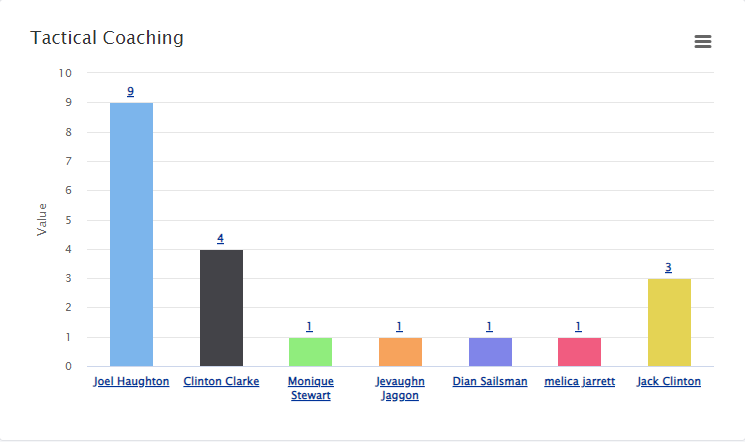
| Tactical Coaching |
Tactical coaching graphs assist the logged-in user to access the comprehensive agent-level coaching data. These statistics are displayed in the Bar Chart format as shown below:
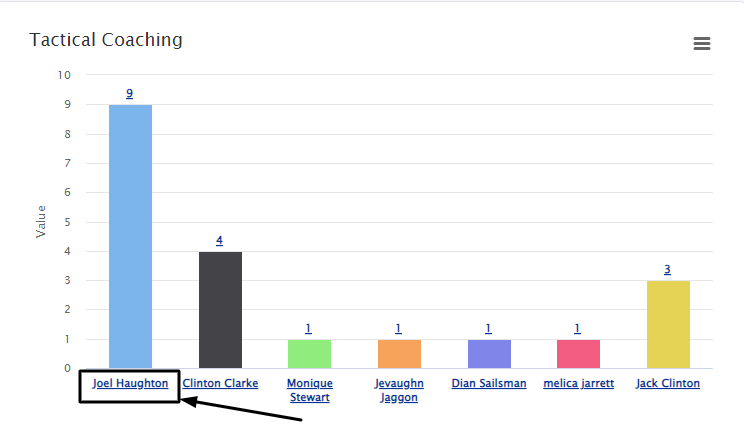
Click on the individual agent’s name displayed below the chart to view the status of only that specific agent as shown below:
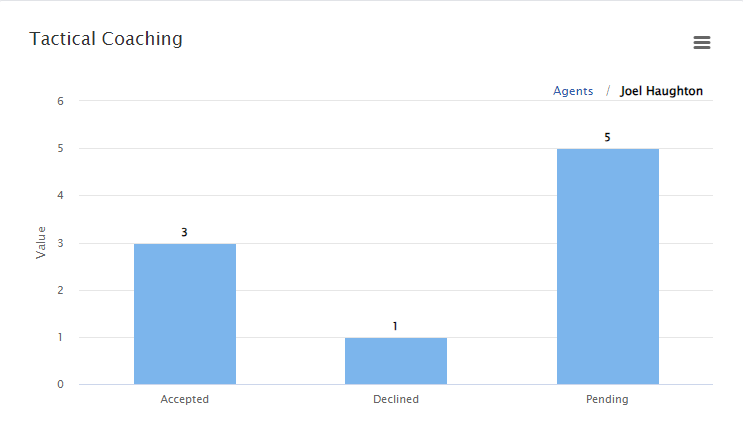
Then, the status of Accept, Decline, and Pending cases of that specific agent will be displayed as shown below:
|
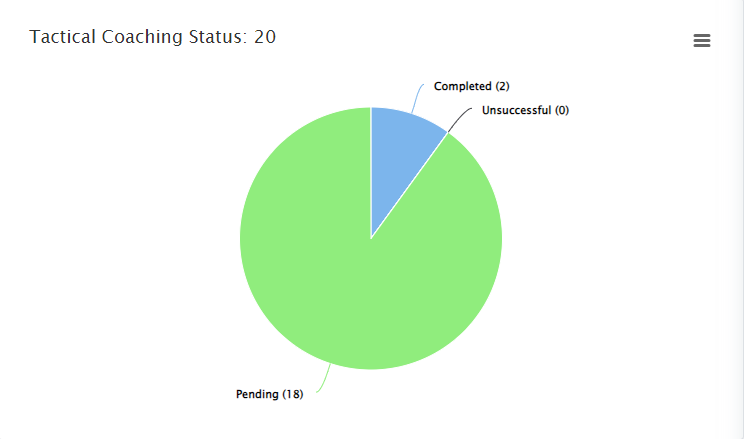
| Tactical Coaching Status |
Tactical coaching status statistics are displayed in the Pie Chart format. On this chart, the user can view the number of completed, pending, and unsuccessful coaching status as shown below:
|
For each statistic displayed on the Dashboard, the logged-in QA Verifier can perform the following actions:
View the Statistics on Full Screen
QA Verifier can view all the stats of the Dashboard in full-screen mode. To do so, click on the Chart Context Menu ![]() icon which is highlighted on the following screen.
icon which is highlighted on the following screen.
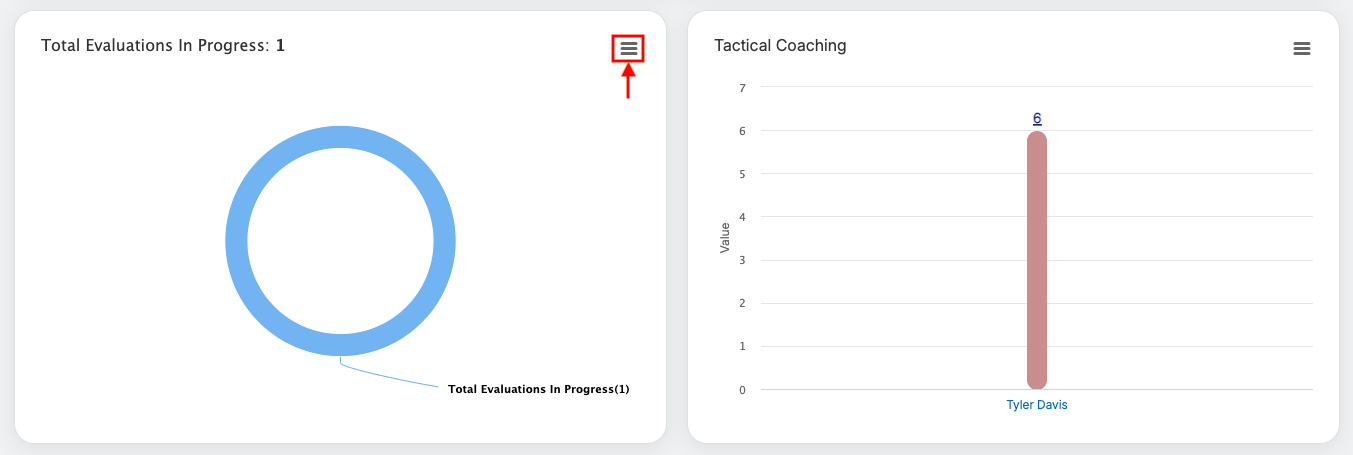
Then, click on the View in full screen option.
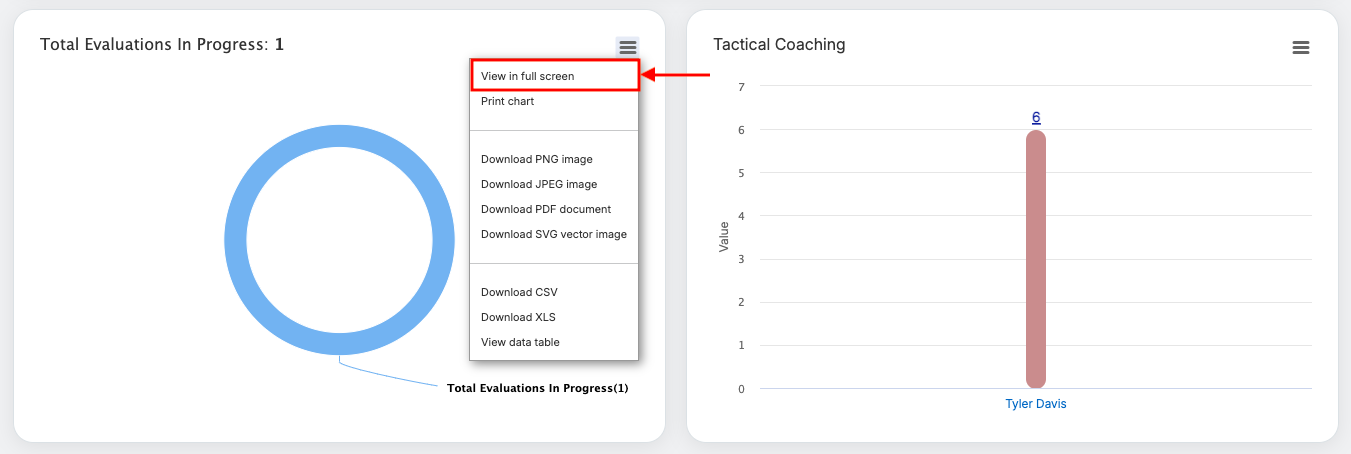
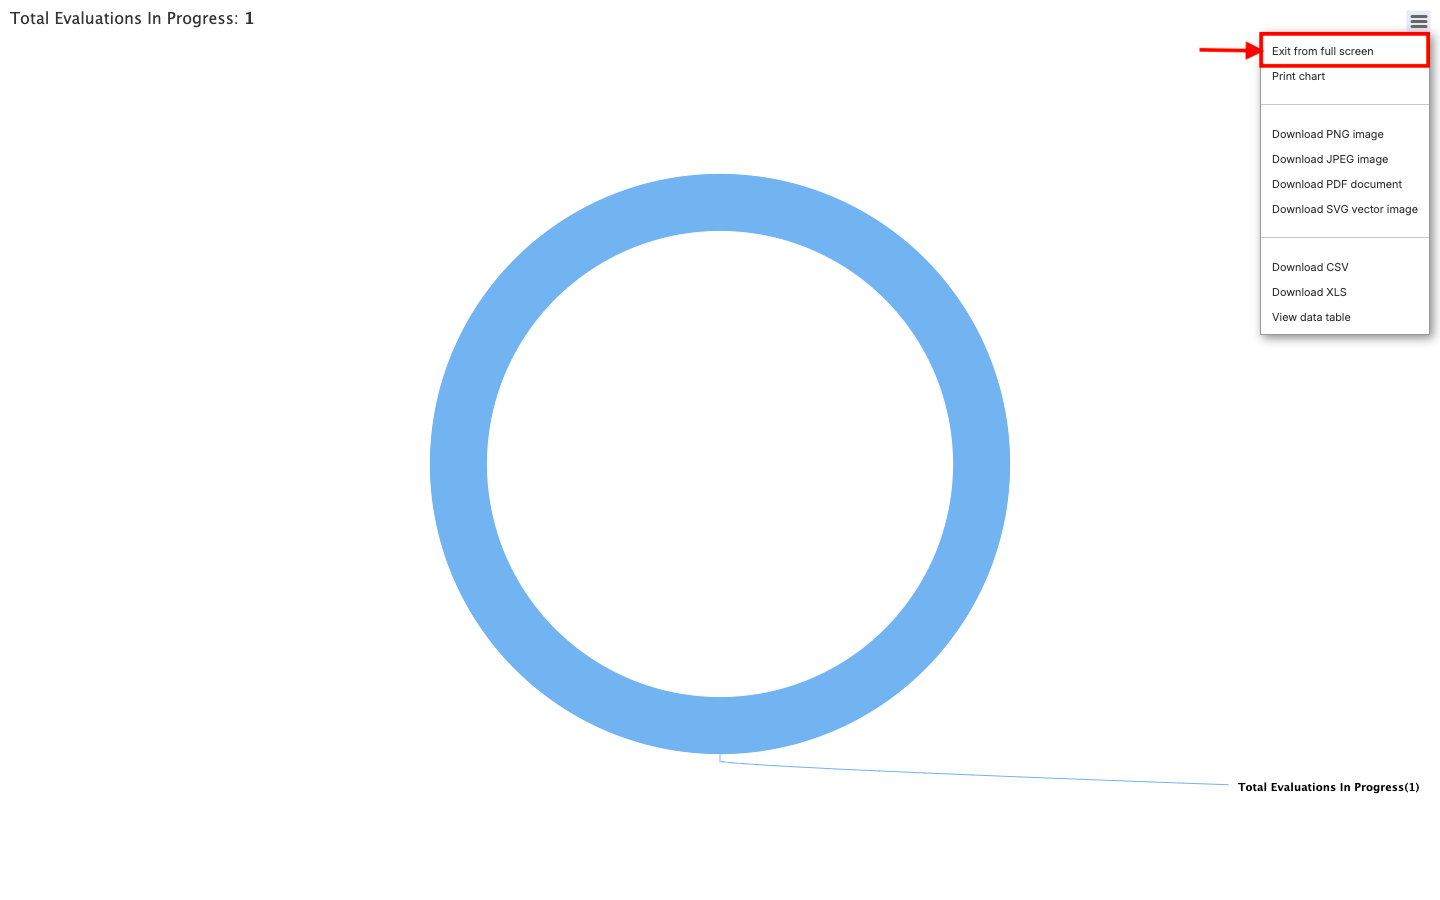
The data will be displayed in the full-screen mode as shown below:
To exit the full-screen mode, click on the Chart Context Menu ![]() icon and select the Exit from full screen option as shown on the following screen:
icon and select the Exit from full screen option as shown on the following screen:
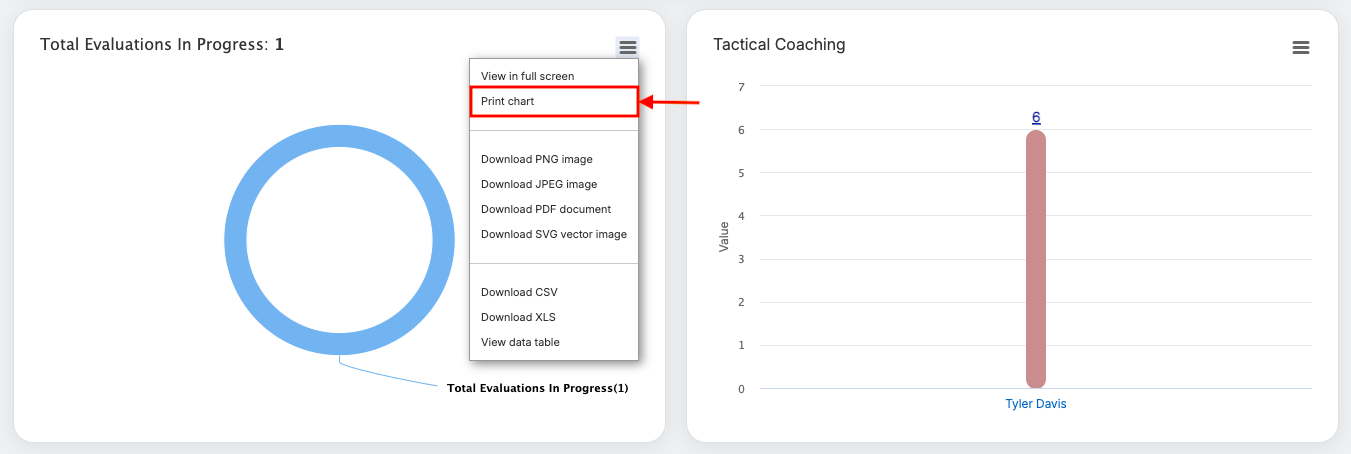
Print Chart
QA Verifier can print the chart and save it in their local system as well. To do so, click on the Chart Context Menu ![]() icon and select the Print Chart option.
icon and select the Print Chart option.
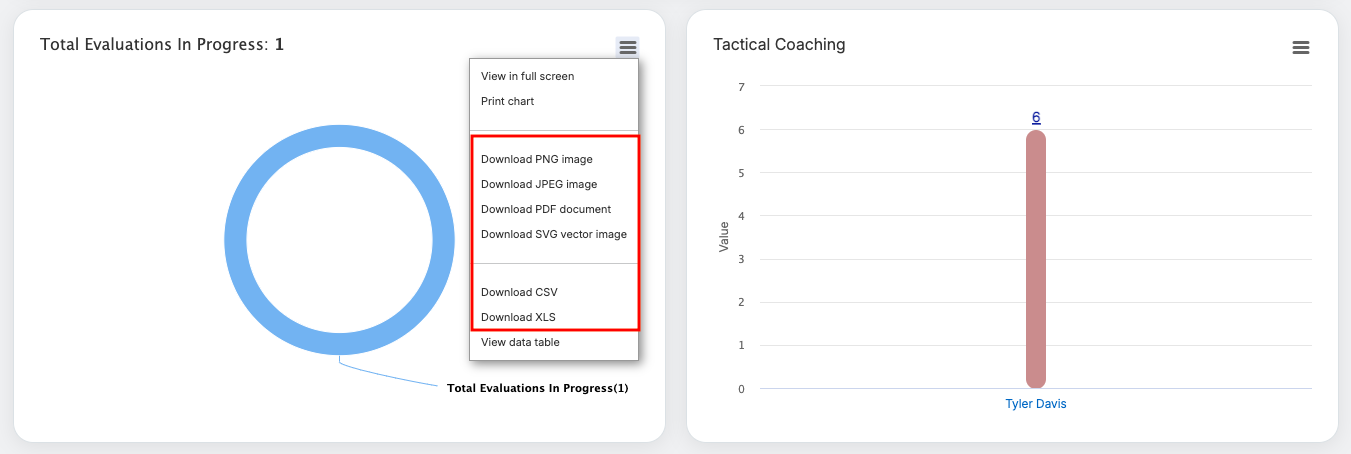
Download Chart
QA Verifier can download each chart/statistic displayed on the Dashboard in:
- PNG image
- JPEG image
- PDF document
- SVG vector image
Agents can also download the data in CSV and XLS format as well.
To download this information in any of the above-mentioned formats, then click on the Chart Context Menu ![]() icon and select the required format.
icon and select the required format.
The particular information will be downloaded into the local system.
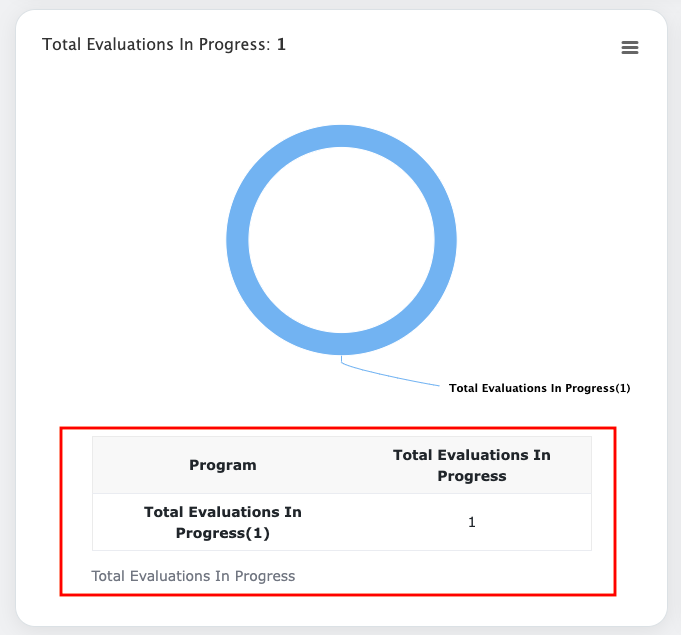
View Data Table
QA Verifier can view the data in the table format which is initially displayed in the Chart format. To do so, click on the Chart Context Menu ![]() icon from the required category and select the View data table option.
icon from the required category and select the View data table option.
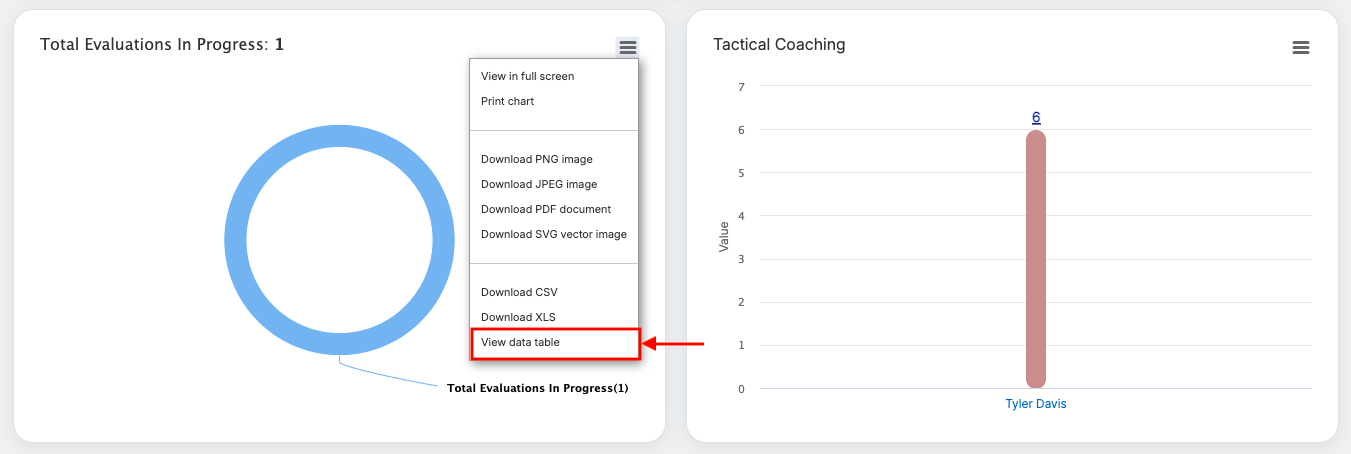
The data table will be displayed for the particular category as displayed below:
Disputed Evaluations
This page displays the total number of disputed evaluations along with individual stats of Open, Closed, and Total disputed evaluations.
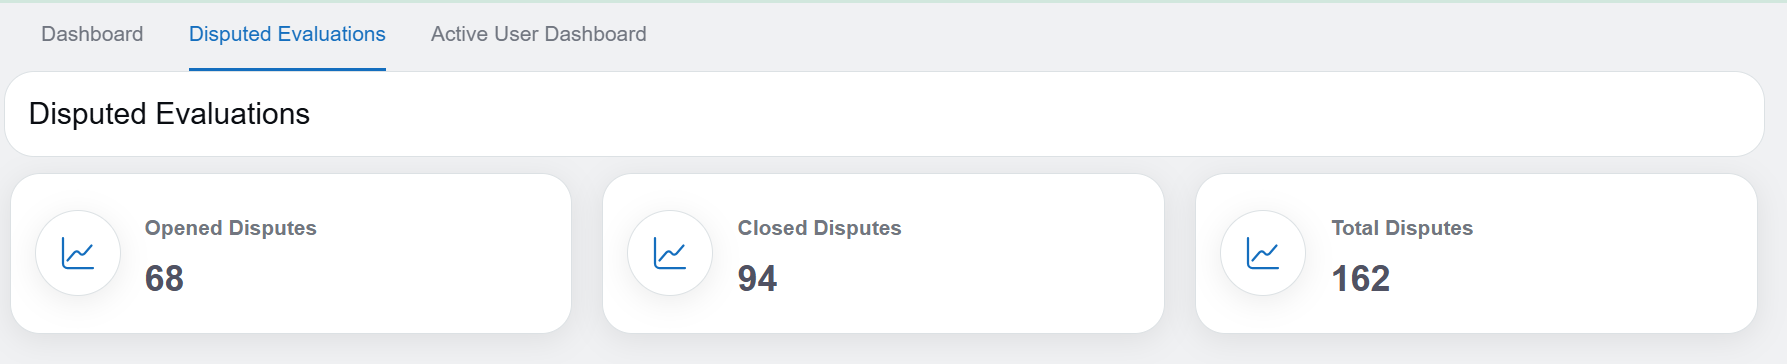
Disputed Evaluations
Click on any of the numeric data displayed for Open Disputes, Closed Disputes, or Total Disputes.
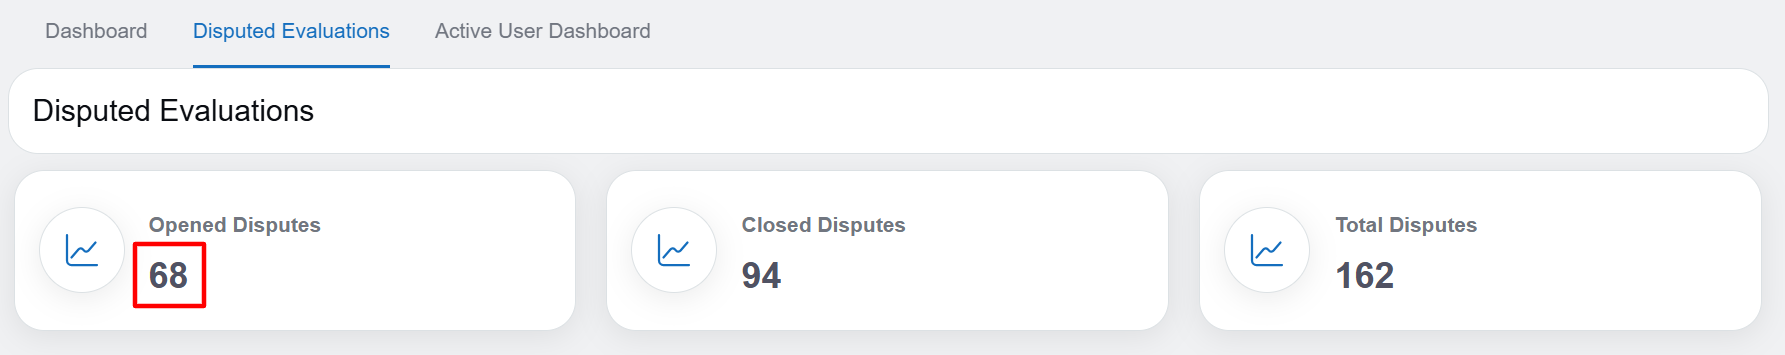
Opened Dispute
QA Verifier will be redirected to the My Disputes page and all the data will be displayed:
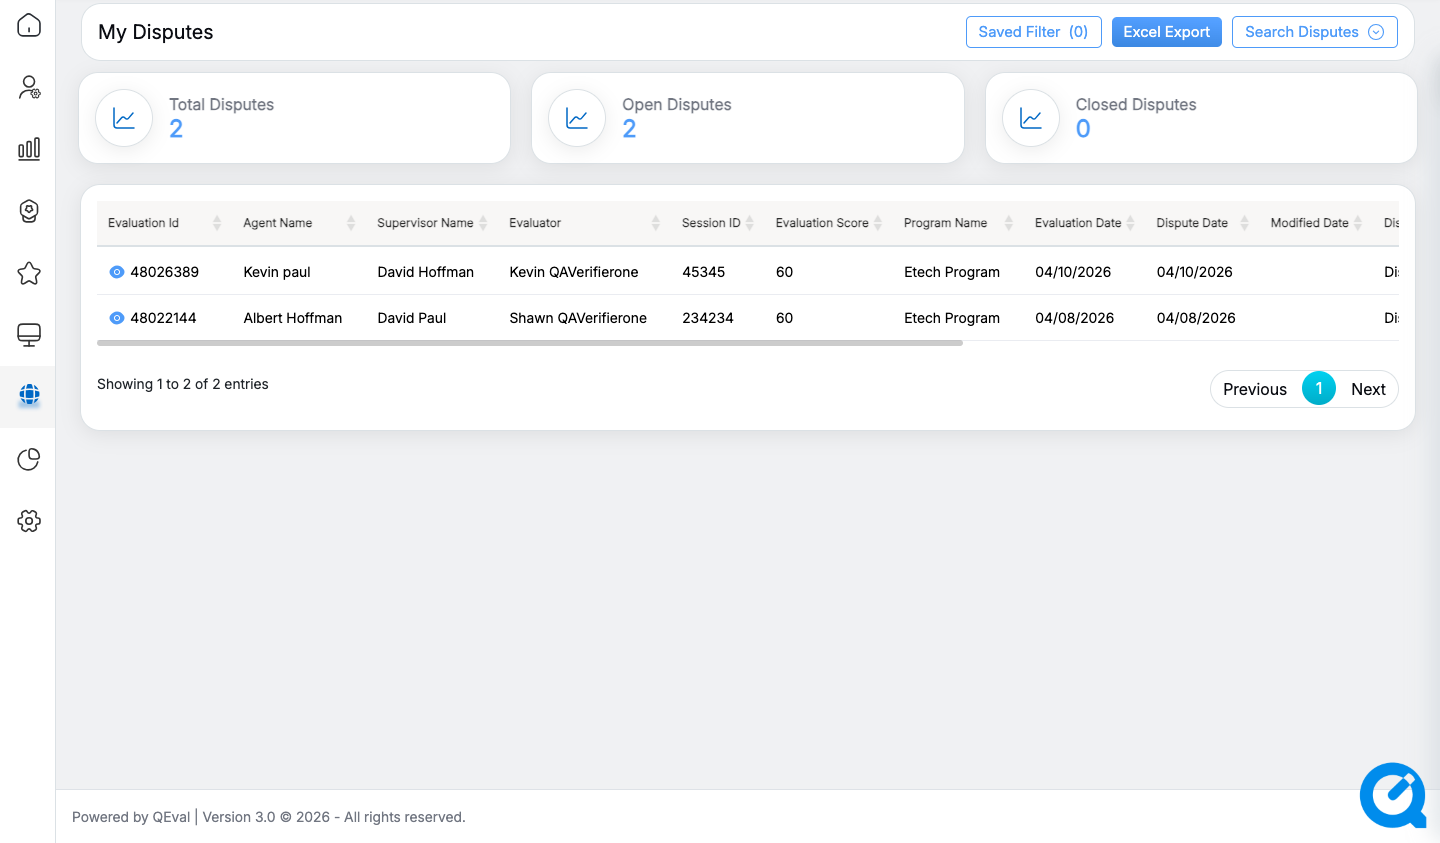
My Disputes Page
Active User Dashboard
When this tab is clicked, the system will redirect the QA Verifier to the active user dashboard console wherein the verifier will be able to view their total active hours. This is as displayed below:
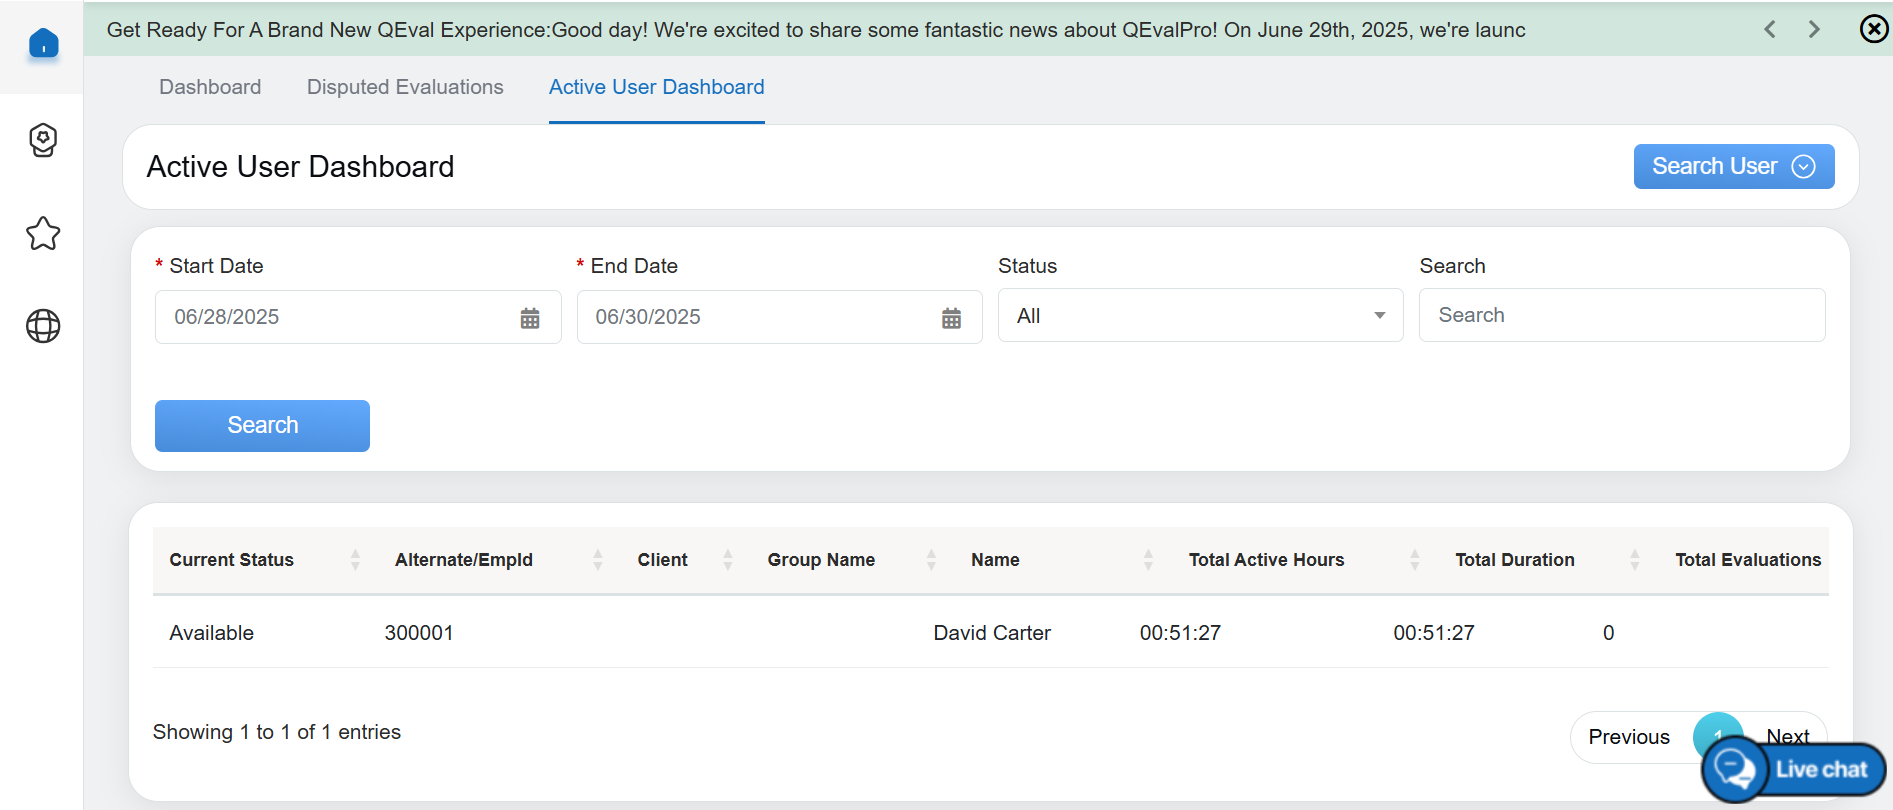
Active User Dashboard
By default, the system will display the active hours for the current day. However, a QA Verifier has the option to view his/her personal active hours for a particular number of days along with his/her team members individually.
To do so, search the data for a specific duration by clicking on the Search User button.
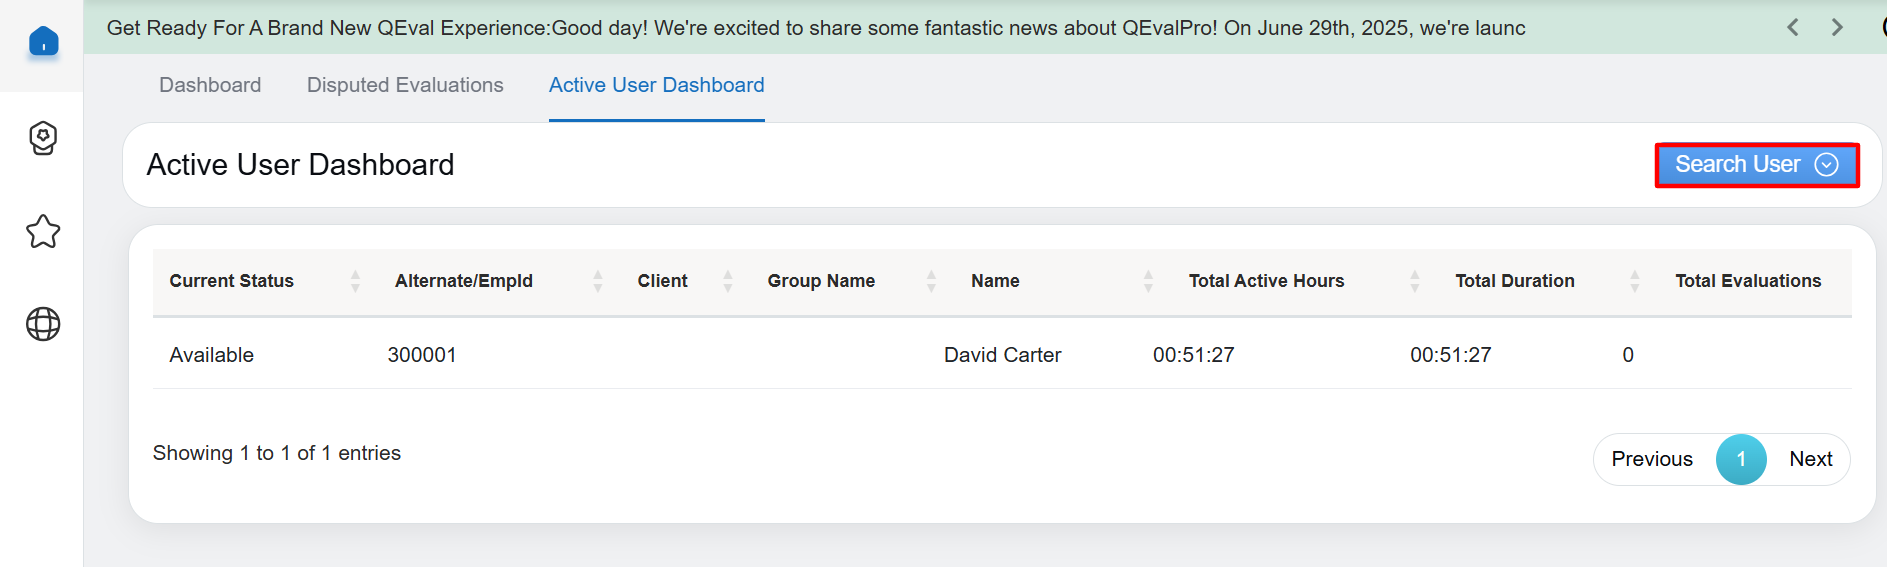
Search User
Then set the date range by selecting the Start Date and End Date from the date picker option. Select the Status from the dropdown field. Enter any relevant keyword in the Search text box to search for any specific data. Then click on the Search button.
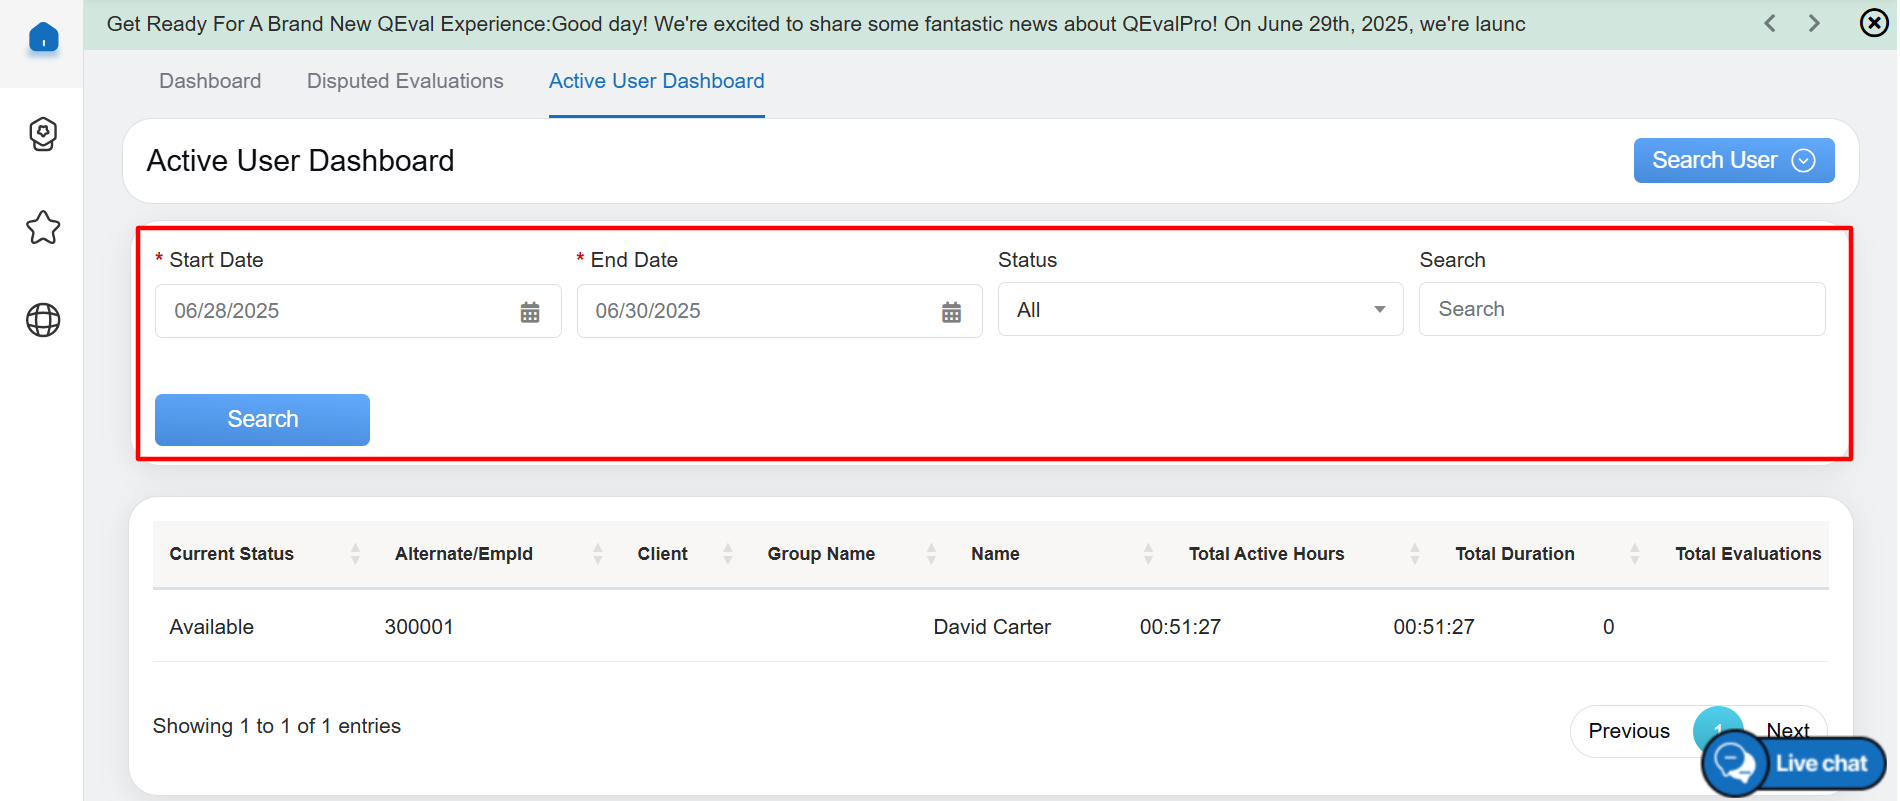
Search Details
Note: The active hours’ data will be displayed in the CST zone.
Video