The Survey Dashboard provides a centralized, real-time snapshot of overall survey performance. It helps users quickly understand customer sentiment and satisfaction levels without navigating into detailed reports.
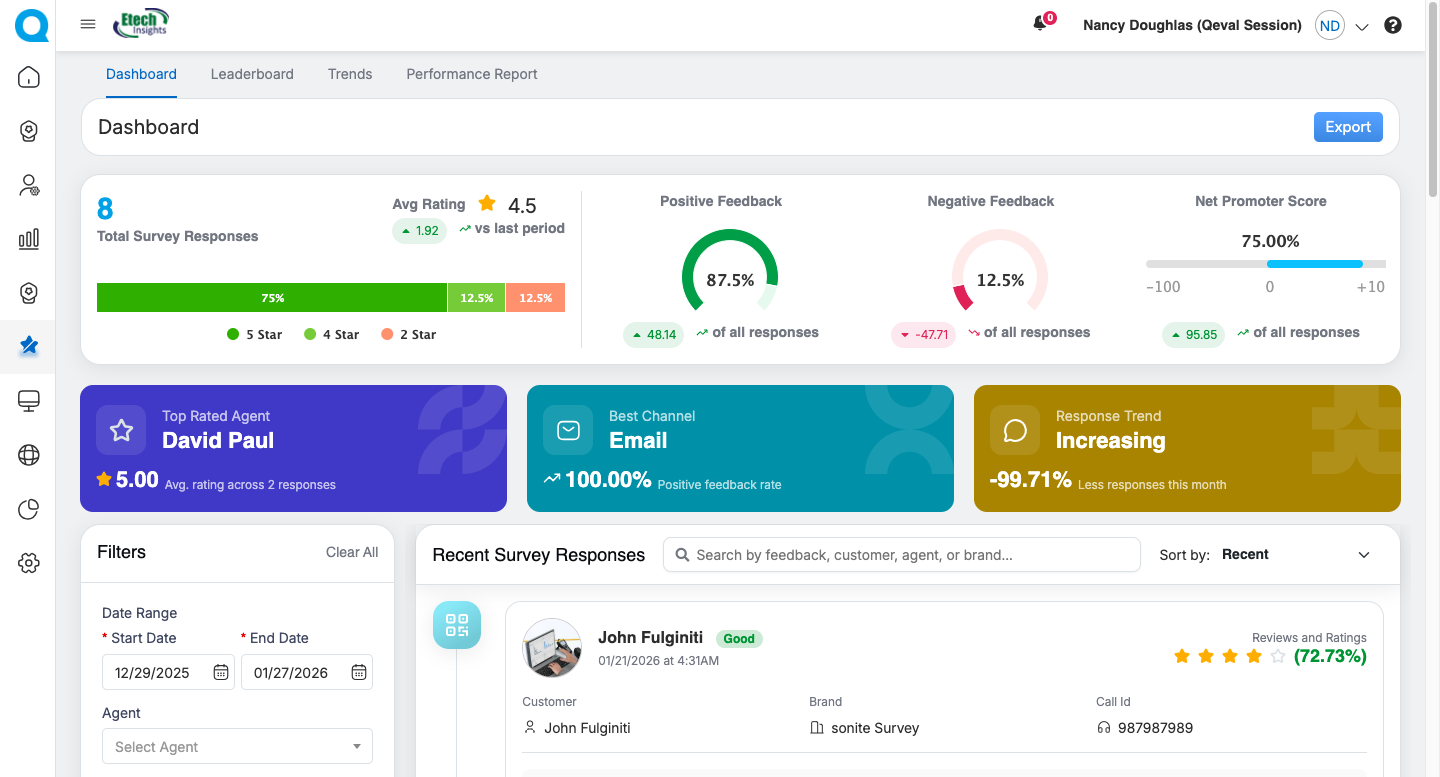
Dashboard – Key Metrics (Quick Cards)
The Survey Dashboard provides a quick, consolidated view of overall survey performance through visually rich Quick Cards. These cards help users instantly understand customer feedback trends, performance highlights, and response behavior without navigating into detailed reports.
Each metric dynamically updates based on the selected filters and date range.
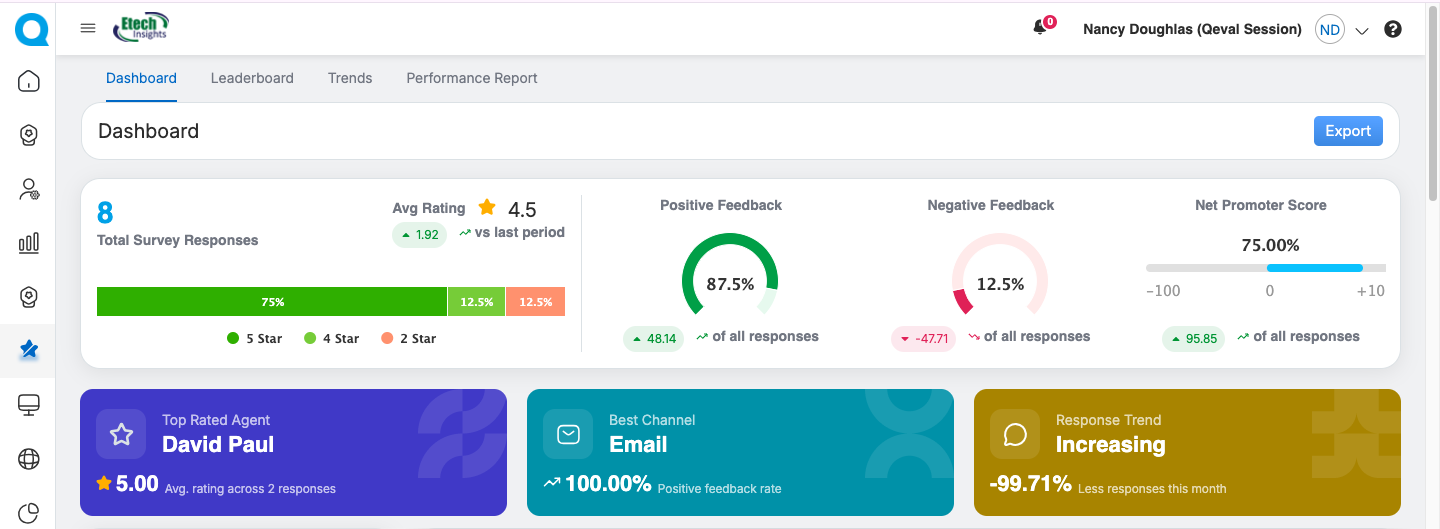
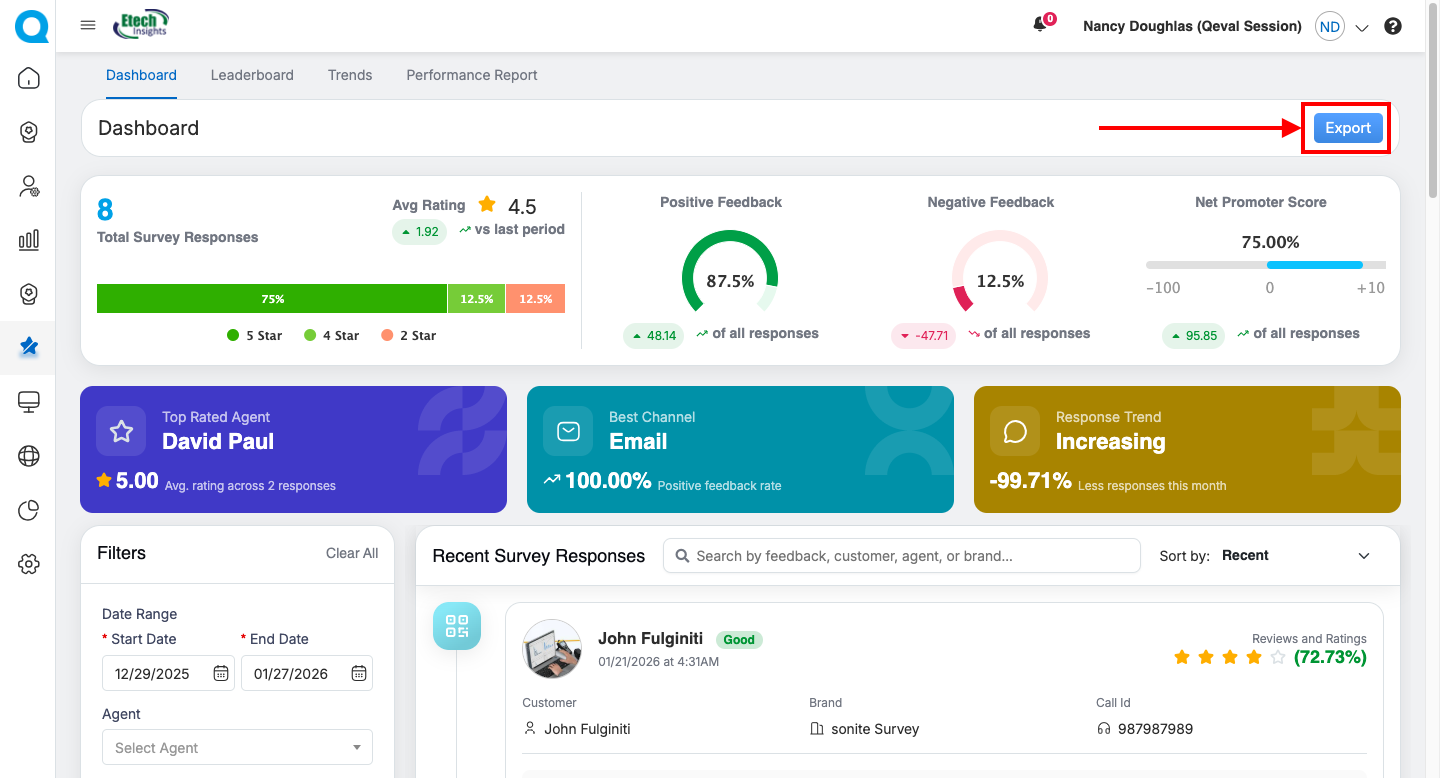
Total Survey Responses & Average Star Rating
This section provides a quick overview of survey participation and overall customer satisfaction for the selected date range.
Total Survey Responses displays the total number of responses received, helping users understand response volume and engagement. A star-wise distribution bar below the count shows how ratings are spread across 5-star to 1-star, with each color-coded segment representing the percentage contribution of that rating.
Average Star Rating shows the overall customer satisfaction score calculated from all survey responses. A trend indicator highlights whether the rating has increased or decreased compared to the previous equivalent period, along with the exact numeric change, enabling users to quickly track satisfaction trends over time.
Customer Sentiment & Loyalty Metrics
This section provides a consolidated view of customer satisfaction, dissatisfaction, and loyalty for the selected date range.
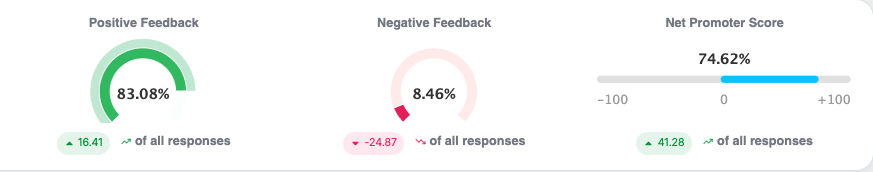
Positive Feedback Percentage represents the share of favorable responses, calculated from 4-star and 5-star ratings. It is displayed using a circular progress chart for quick visual understanding and includes a trend indicator showing improvement or decline compared to the previous period.
Negative Feedback Percentage reflects the proportion of unfavorable responses, calculated from ratings below 3. It is also shown in a circular progress chart with a trend indicator, helping users quickly identify potential service gaps or quality concerns.
Net Promoter Score (NPS) displays customer loyalty on a -100 to +100 scale, with a visual slider indicating the current position. A trend indicator highlights changes versus the previous equivalent period, enabling users to assess overall likelihood to recommend.
Together, these metrics offer a clear snapshot of customer sentiment and loyalty trends, supporting faster and more informed decision-making.
Performance Highlights & Engagement Insights
This section presents quick insights into agent performance, channel effectiveness, and response behavior for the selected date range.
The Top Rated Agent card highlights the best-performing agent based on survey feedback, displaying the agent name, average star rating, and the number of responses considered. This helps recognize high-performing agents and supports effective performance benchmarking.
The Best Channel card identifies the communication channel (Email, SMS, or QR Code) with the highest positive feedback percentage, enabling users to understand which channel delivers the best customer satisfaction.
The Response Trend card indicates whether overall survey responses are increasing or decreasing, along with the percentage change compared to the previous period and a clear directional indicator. This provides visibility into customer engagement momentum over time.
All Quick Cards update dynamically based on applied filters. Trend indicators compare results with the previous equivalent time period, and if data is unavailable, the card displays “No Data Found.” Selecting any card or related metric enables drill-down navigation to detailed views.
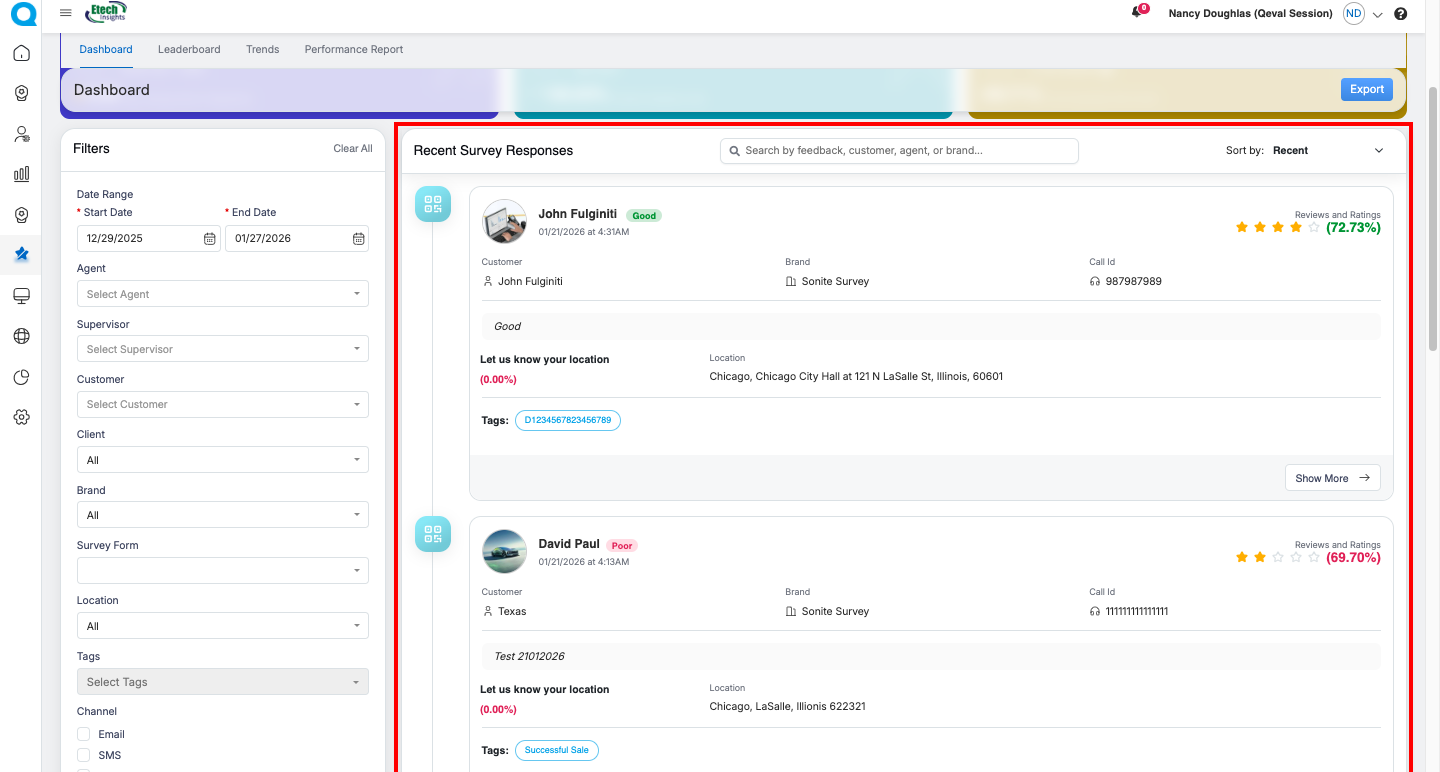
Filter Panel
The Survey Dashboard includes a comprehensive filter panel that allows users to refine data and focus on specific survey insights.
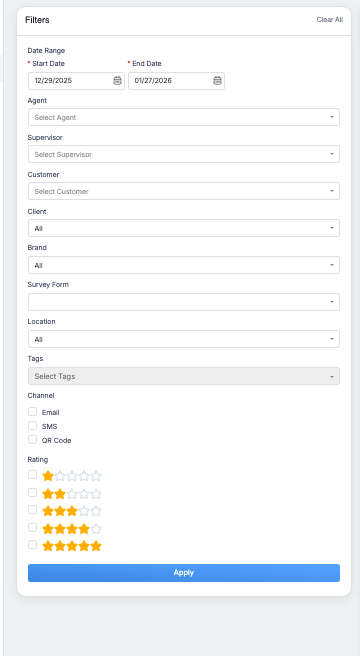
Users can apply filters based on:
- Date Range by selecting a Start Date and End Date
- Agent and Supervisor
- Customer and Client
- Brand
- Survey Form
- Location
- Tags (multi-select)
- Channel options including Email, SMS, and QR Code
- Rating selection using star-based filters (1 to 5 stars)
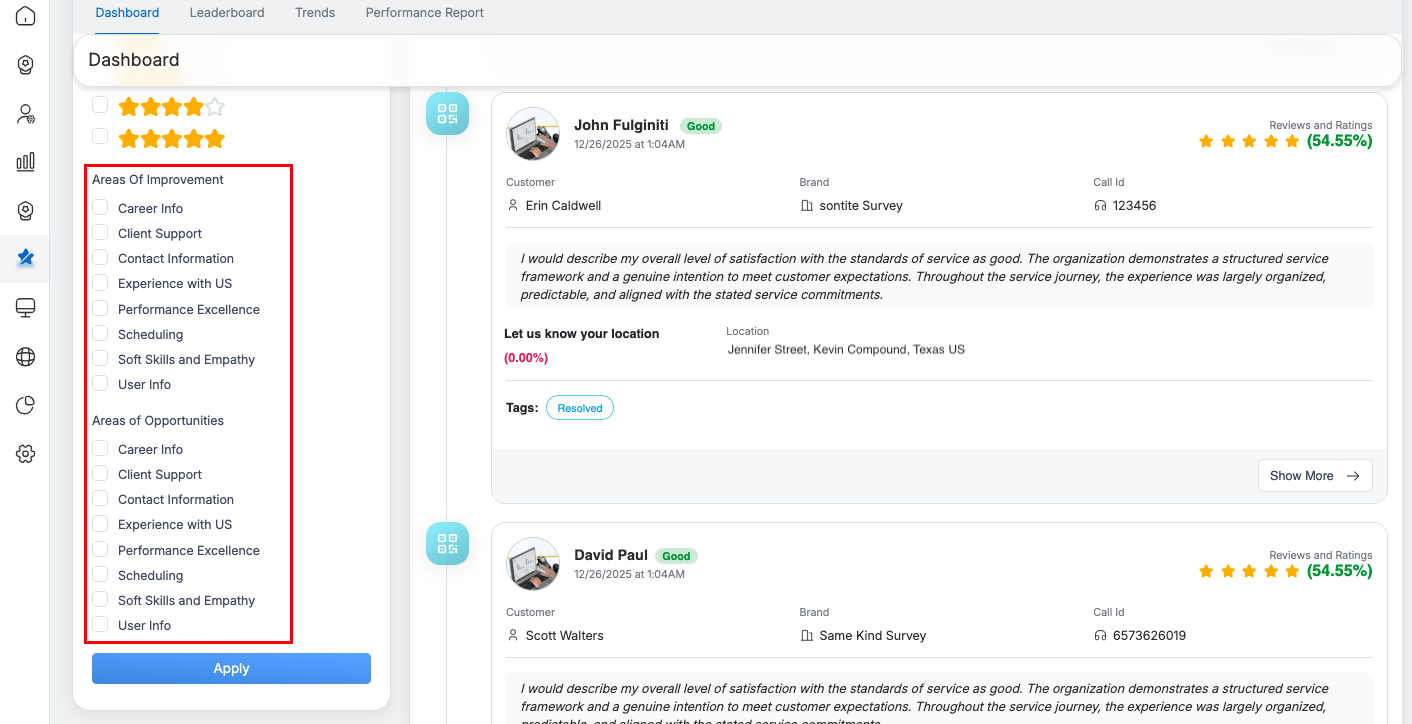
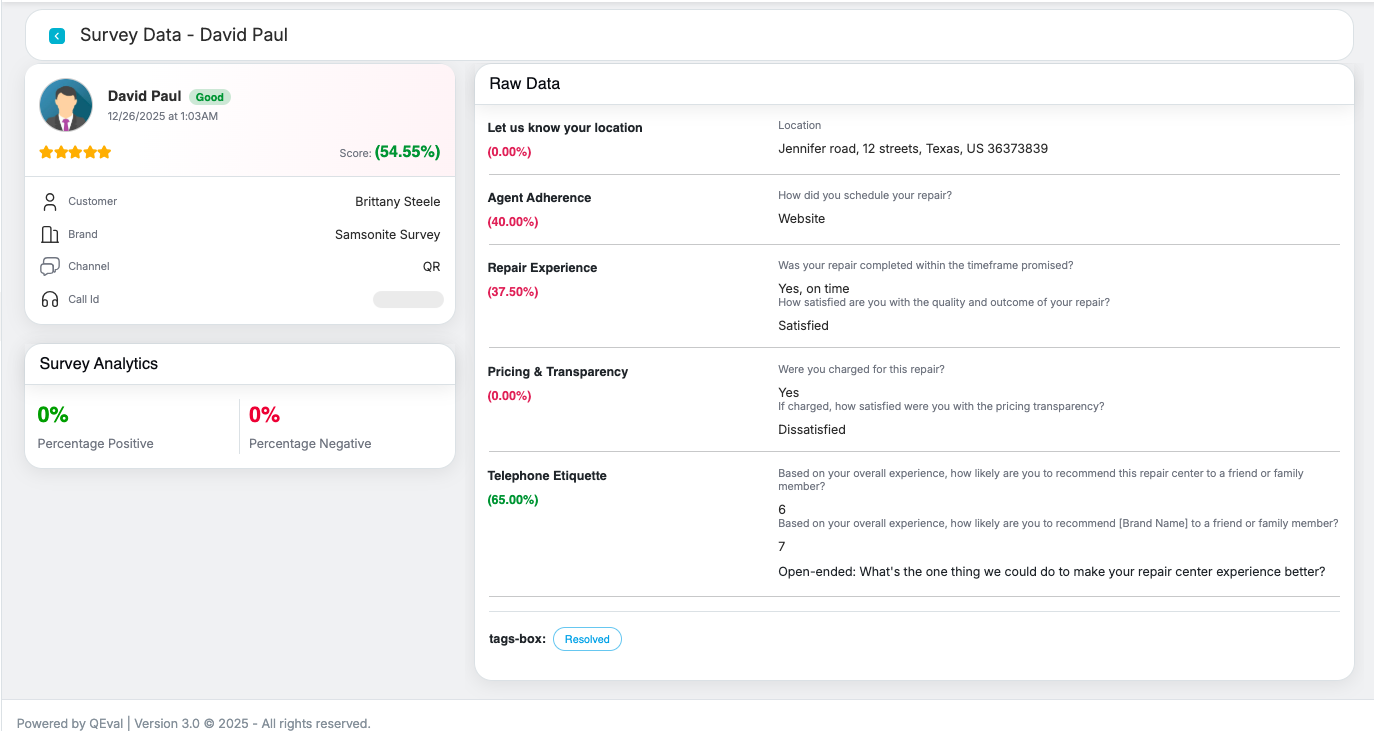
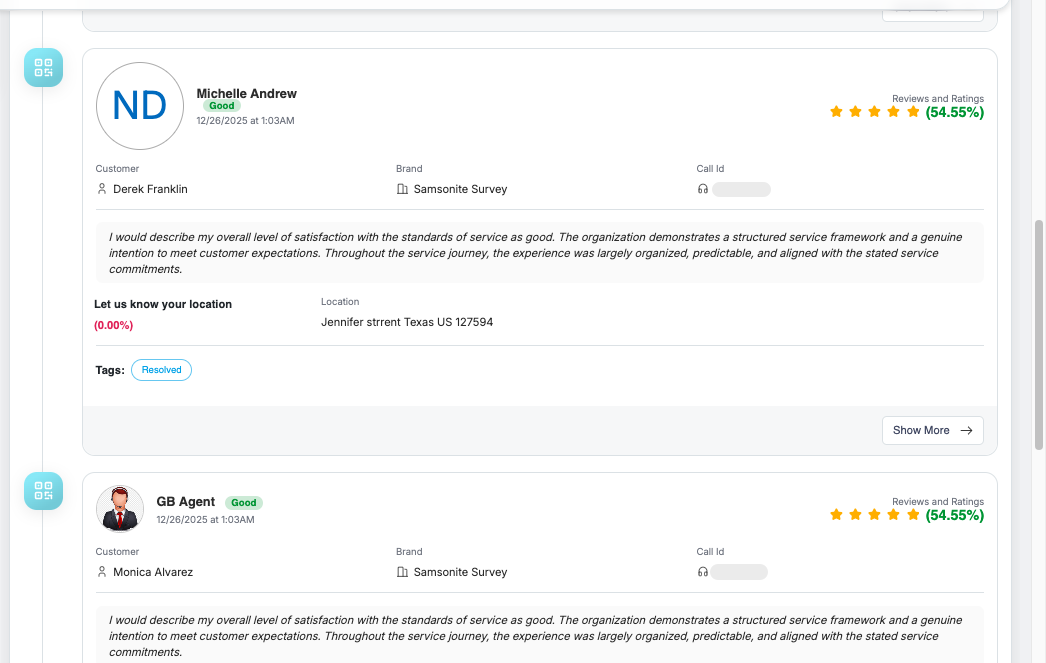
Survey Response Card Overview
Each survey response is displayed as an individual card containing the following details:
- Agent name, sentiment label (Good/Neutral/Negative), and survey submission date/time
- Star rating with percentage score for quick satisfaction assessment
- Customer name, brand name, call ID, and interaction context
- Customer feedback text displayed in a readable format
- Location details (if provided) with response percentage
- Tags (such as Resolved) for easy categorization
- A Show More option to expand and view additional survey details or drill down further
Export Dashboard Data
The Export option allows users to download the dashboard data for offline analysis and reporting.
How It Works
-
Click the Export button located at the top-right corner of the Dashboard.
-
The system exports the dashboard data based on the currently applied filters (such as date range, agent, customer, brand, etc.).
-
The data is exported in an Excel file and contains detailed, survey-level information. The sample Excel file shown below illustrates the export format and represents the output from a specific Survey Dashboard, provided for reference.
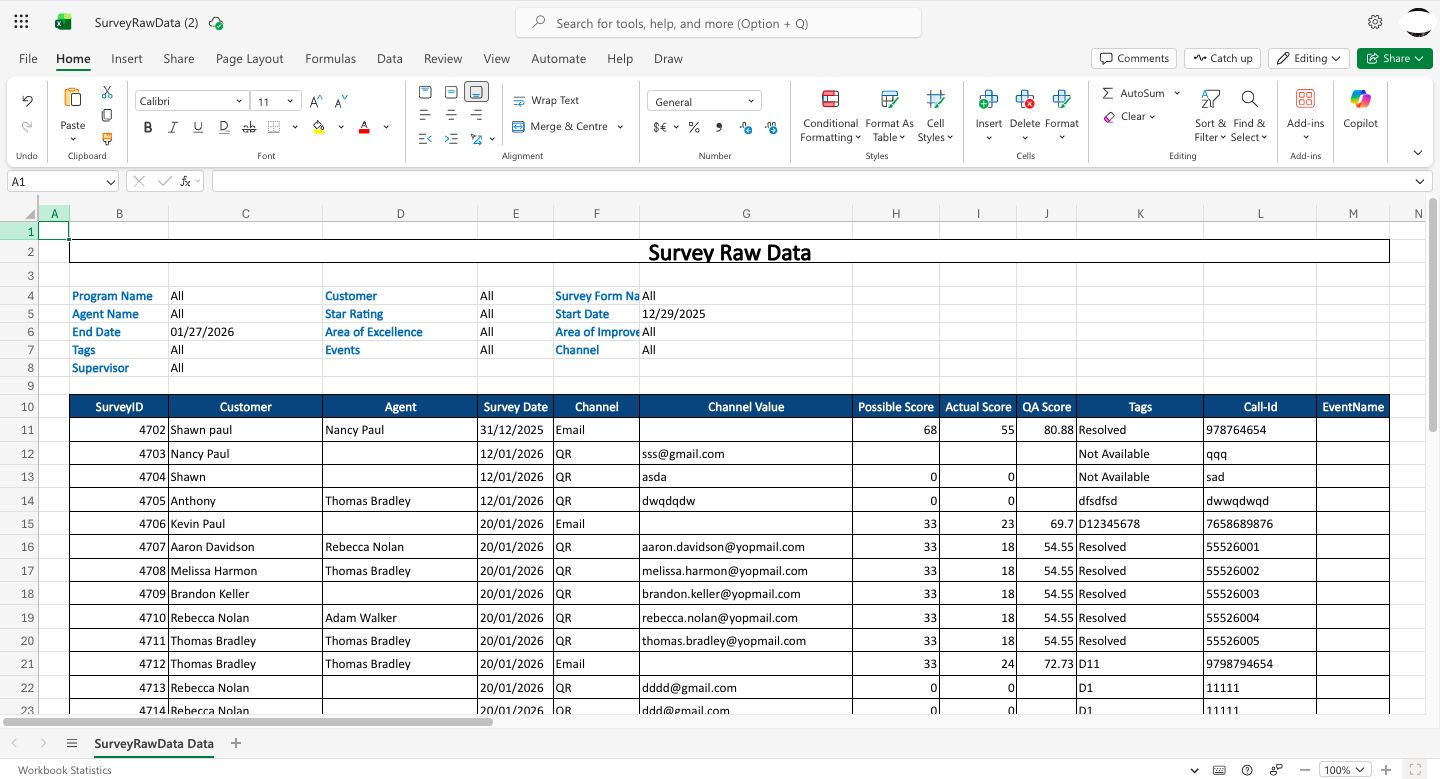
At the top of the Excel sheet, the file shows the filters used to generate the data, such as Program Name, Customer, Agent Name, Supervisor, Survey Form Name, Star Rating, Area of Excellence, Area of Improvement, Events, Channel, and the selected Start and End Date.
Below these filters, the Excel file displays the survey data in a table format, with columns like SurveyID, Customer, Agent, Survey Date, Channel, Channel Value, Possible Score, Actual Score, QA Score, Tags, Call-Id, and EventName, making it easy to review and analyze the exported survey information
Key Notes
- Exported data reflects only the data visible based on applied filters.
- This feature helps users analyse survey results externally or share data with stakeholders.
Video