Program Summary Report displays the section-wise QA score of the calls for the selected duration.
To access this feature, click on the Menu ![]() button or move the mouse on the left side of the page to open the menu bar, then click on the Reports
button or move the mouse on the left side of the page to open the menu bar, then click on the Reports ![]() option and select Report, as shown below:
option and select Report, as shown below:
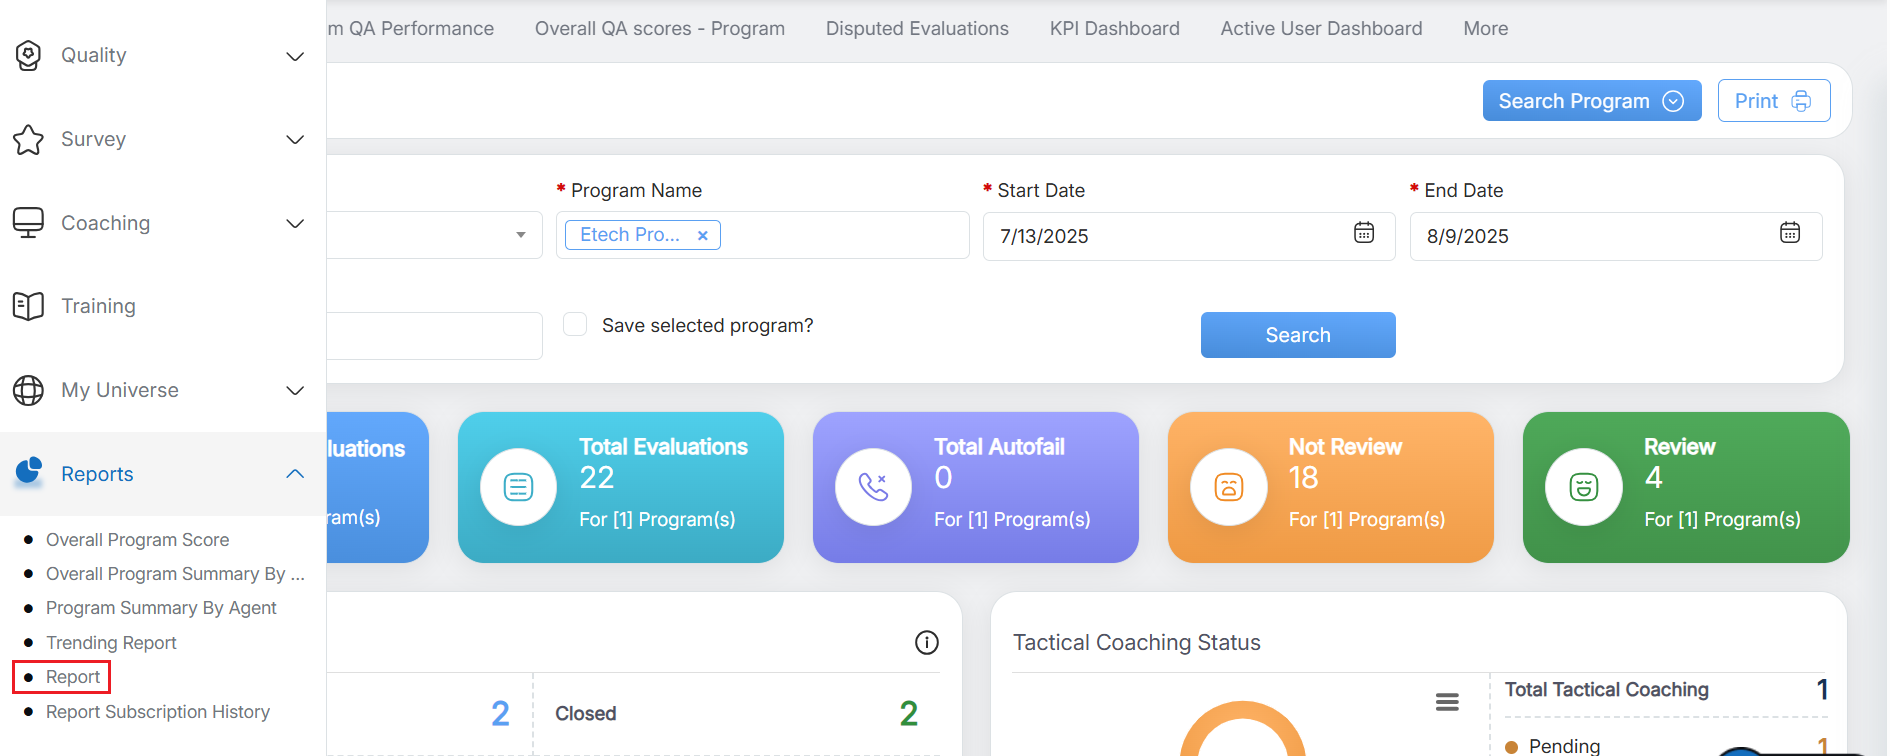
Report
The system will direct the user on the Reports page, click on the Reports Home button as highlighted in the screen below:
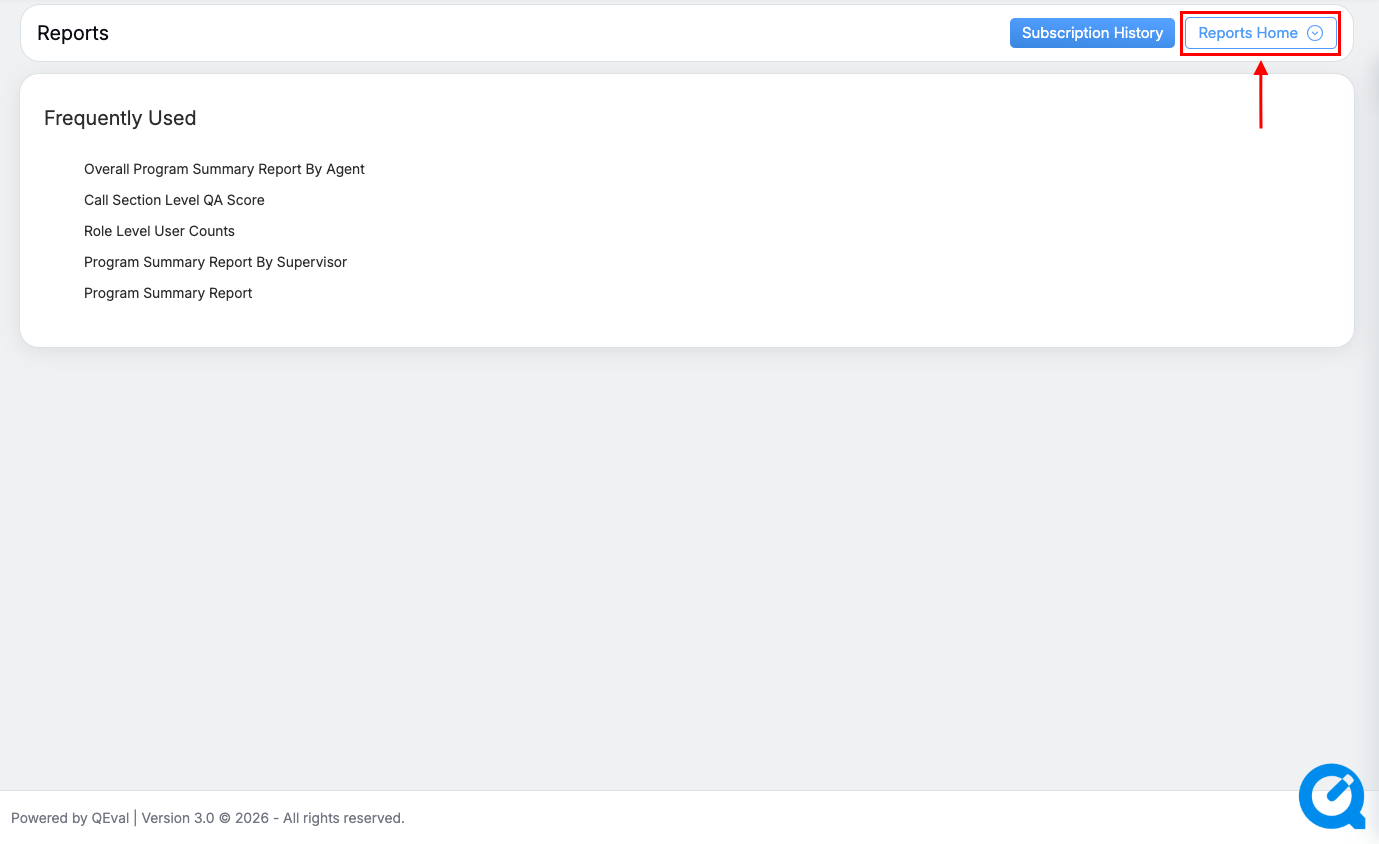
Reports Home
The Reports Home window will be opened on the same page. The Search Bar displayed on the window allows the user to search any specific report by entering keywords in the search bar text-box, as shown below:
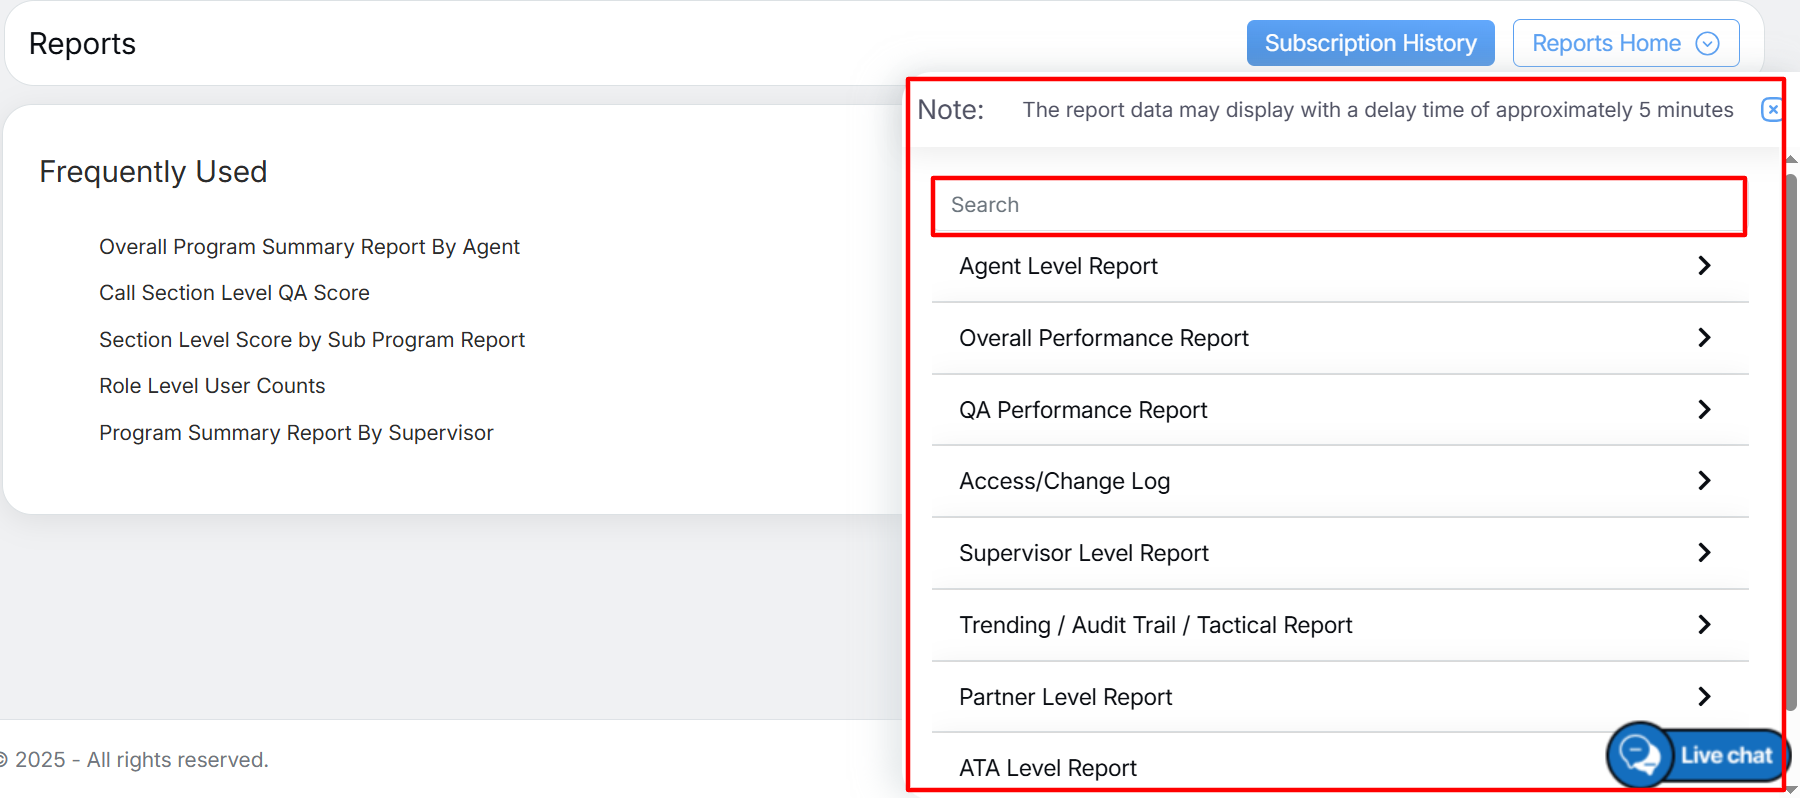
Search Bar Text Box
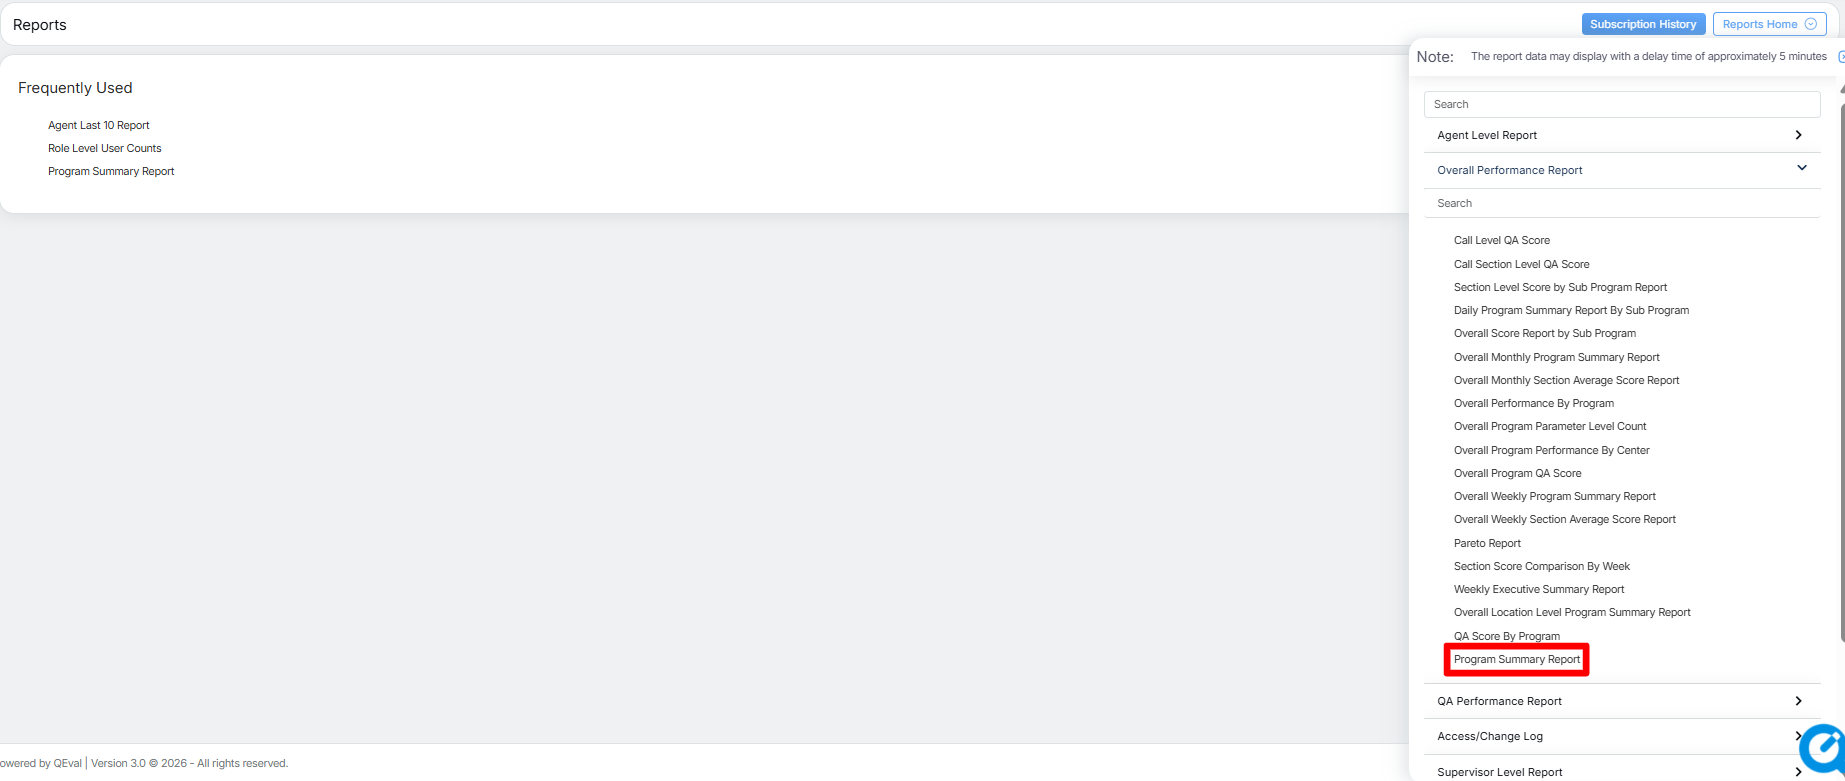
Program Summary Report
To view this report, select Overall Performance Report > Program Summary Report as shown below:
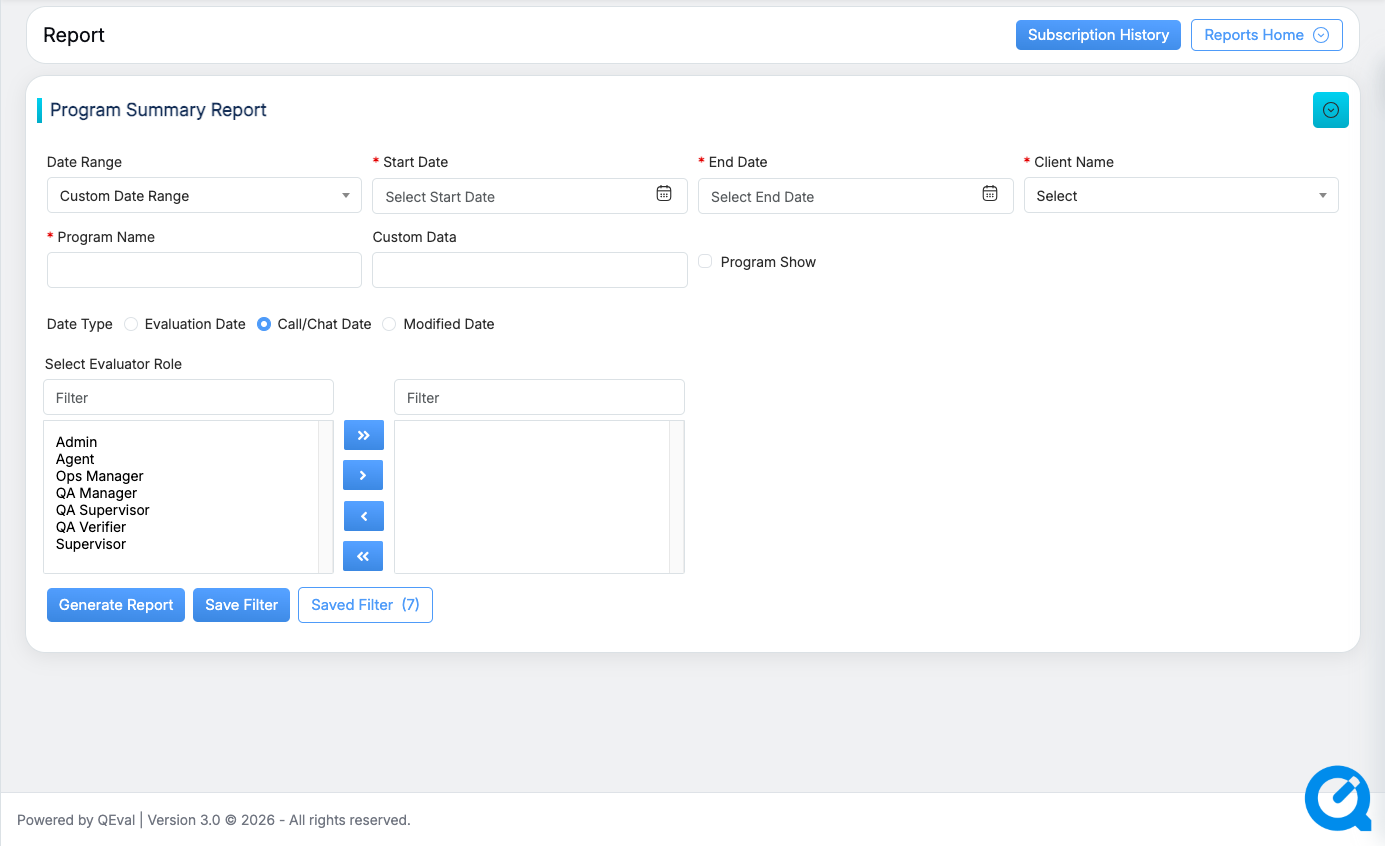
The Program Summary Report page will be displayed.
|
Screen Elements |
Description |
|---|---|
|
Date Range |
User can define a date range by either selecting from predefined timeframes in the dropdown or specifying a custom range based on the need. Available filters include Today, Last 7 Days, Last 10 Days, Last 30 Days, Last 12 Weeks, Last 6 Months, and Custom Date Range. Select the option that best suits your requirements. |
|
Start Date |
If user selects the custom date range then users would be able to select the start date and end date as per their need. |
|
End Date |
Select the end date. |
|
Client Name |
Select the name of the client from the dropdown list. |
|
Program Name |
Select the name of the program from the dropdown list as per the selection of the Client Name. |
|
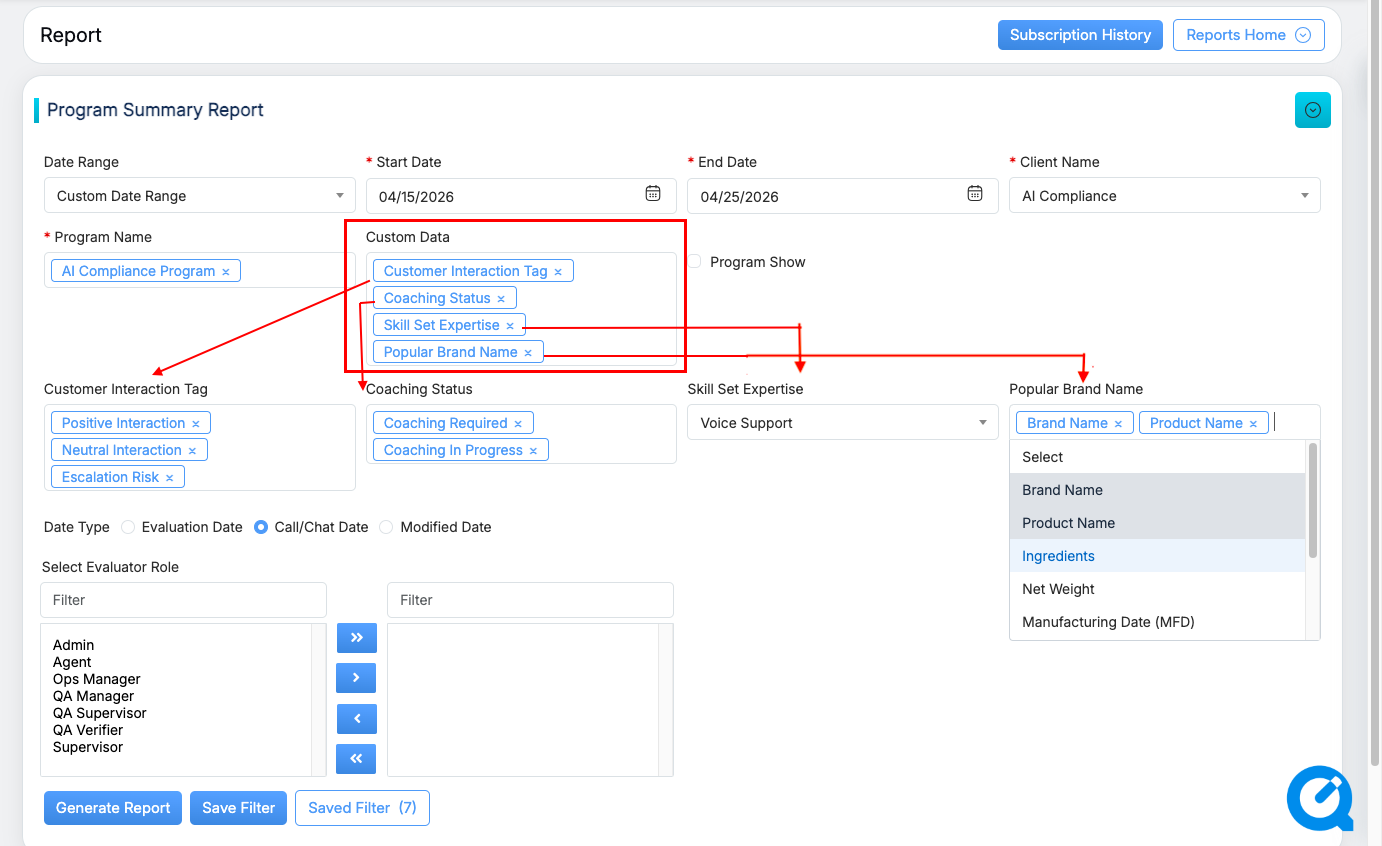
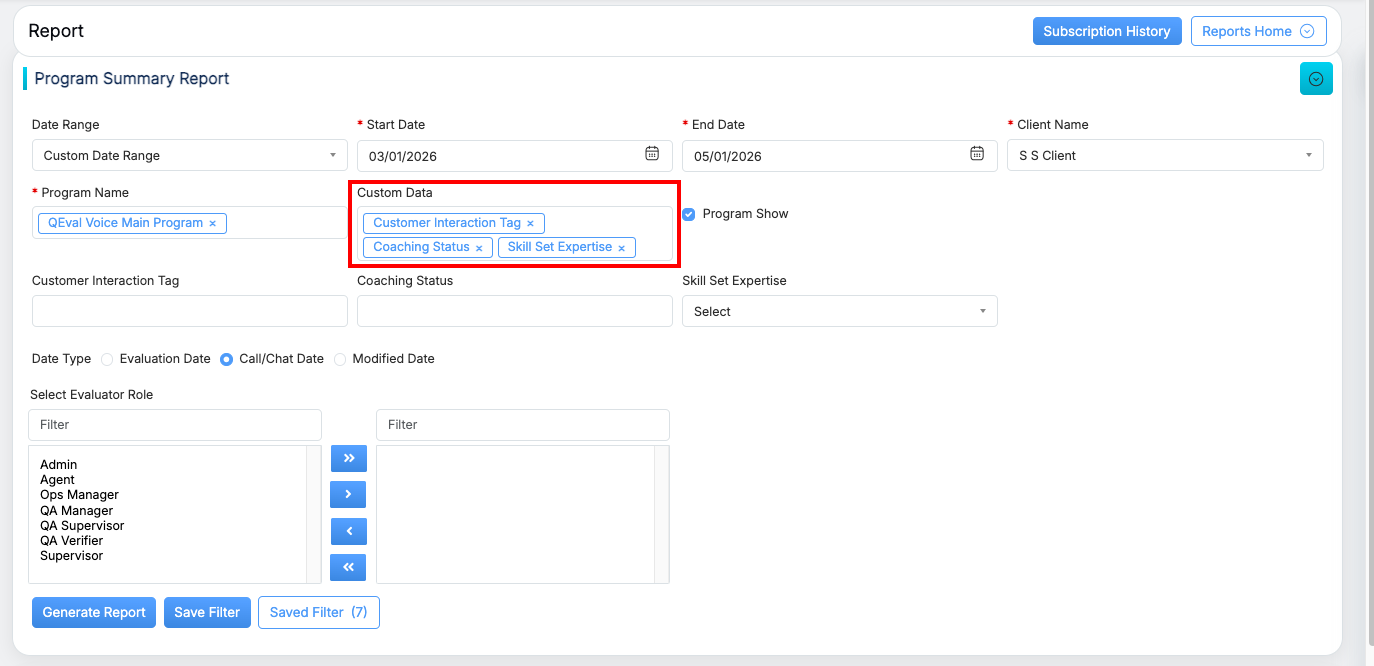
Custom Data |
Select one or more custom data fields to refine your report results. Each selected field dynamically appears as a dedicated filter below, allowing you to specify exact values, such as interaction type, coaching status, or skill set, before generating the report.
|
|
Program Show |
Enable this checkbox to display program-wise details separately in the generated report. |
|
Date Type |
|
|
Evaluator Role |
Select the required Evaluator role from the left-hand side box which will display the list of all the user roles of higher order which includes:
One can also search the roles by entering the role’s name in the Filter field. Once the role(s) is selected, click on To move all the roles to the right-hand side box at once, click on To remove a few roles from the right-hand side box and move them back to the left-hand side box, firstly, select such roles and then, click on To move all the roles from the right-hand side box to the left-hand side box at once, click on |
Once the search criteria are set, then, click on the ![]() button. This provides consolidated summaries across multiple programs and also includes support for custom fields.
button. This provides consolidated summaries across multiple programs and also includes support for custom fields.
Program Summary Report Details
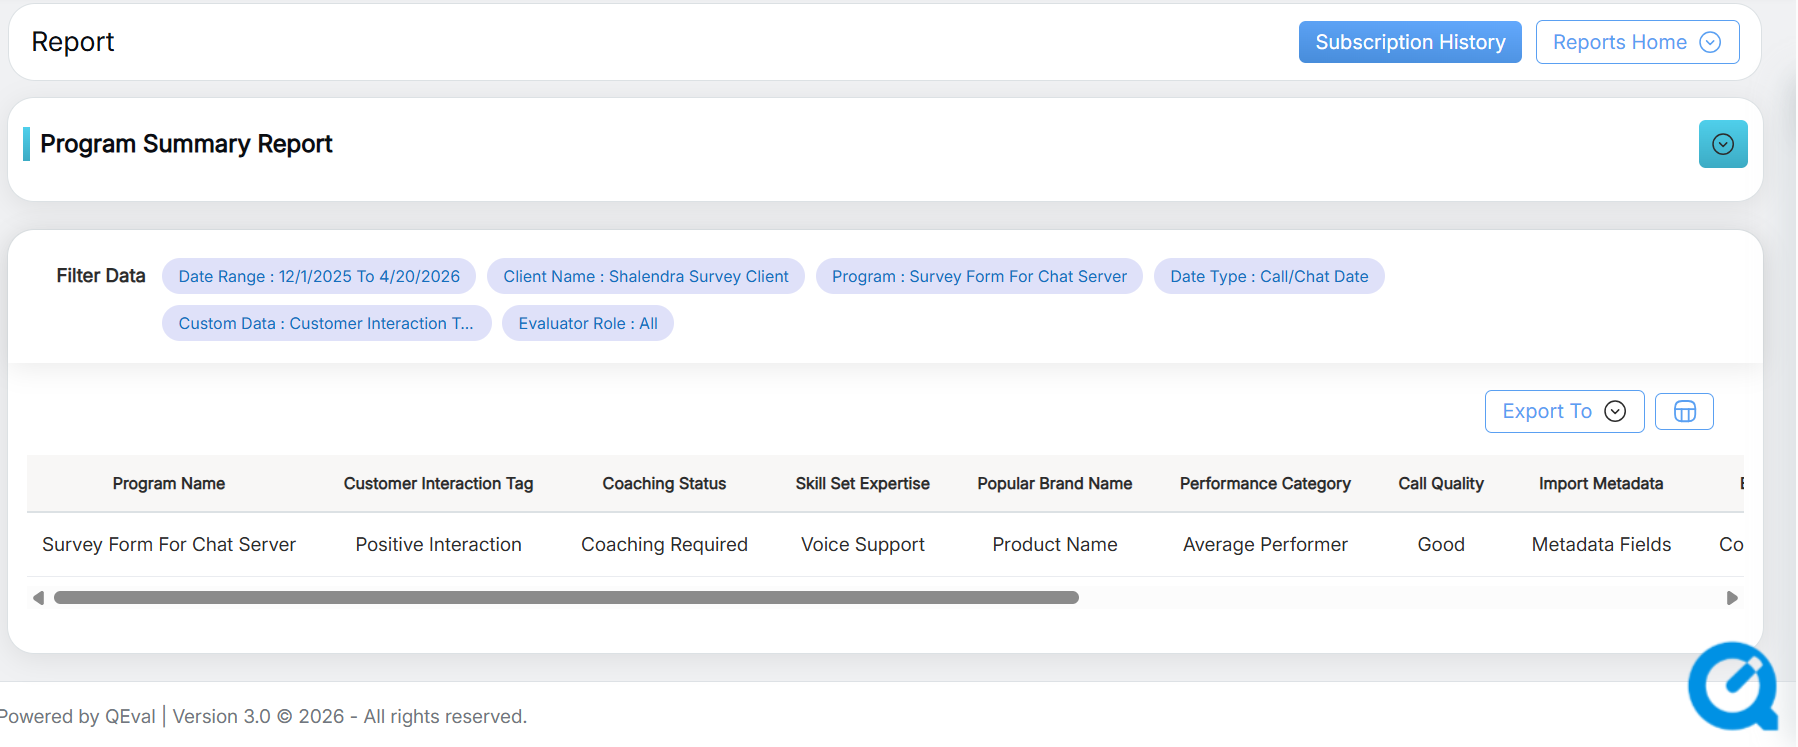
Report Columns
The following columns are displayed upon generating the report:
- Program Name — Displays the evaluated program name. This column appears only when the Program Show option is enabled in the filter panel, showing program-wise data as separate rows in the report.
- Custom Data — Each custom data field selected in the filter panel appears as its own column in the report. The values displayed reflect the specific custom field selections applied, allowing results to be viewed across the chosen dimensions.
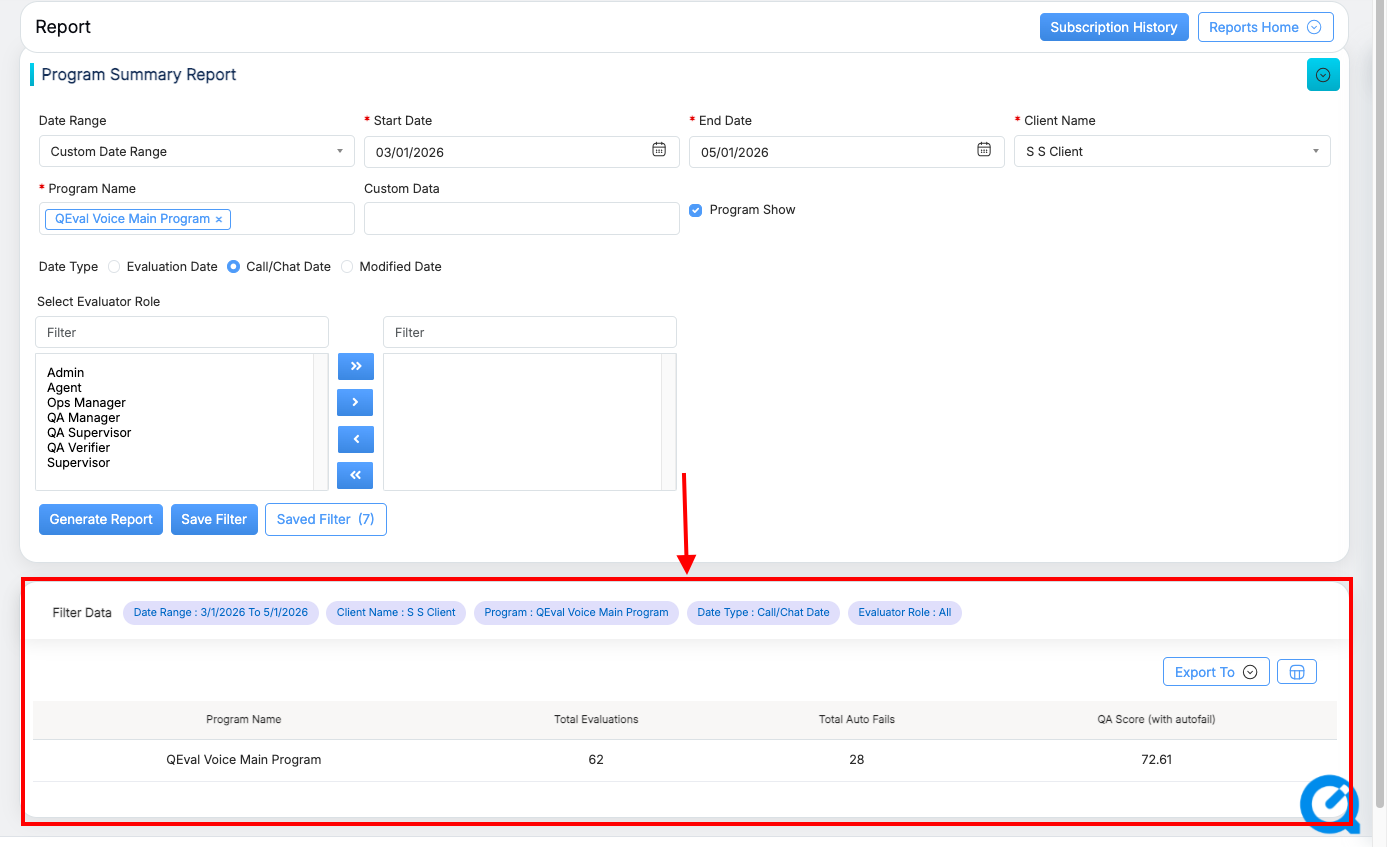
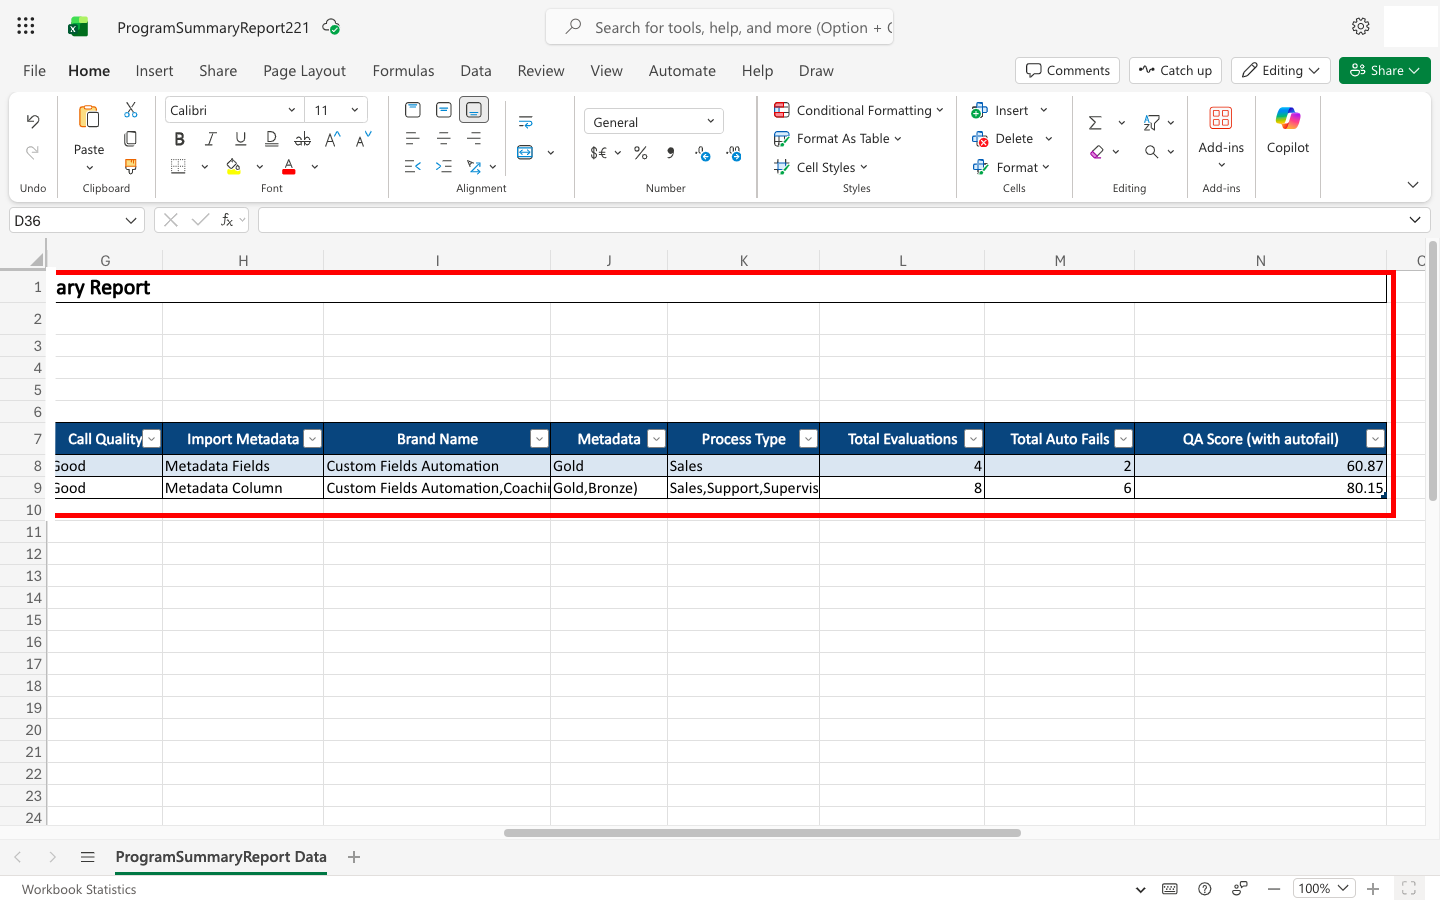
- Total Evaluations — The total number of evaluations completed within the selected date range.
- Total Auto Fails — The number of evaluations that resulted in an automatic failure during the selected period.
- QA Score (With Auto Fail) — The overall quality score for the program, calculated with auto fails factored in.
Understanding the Report Output
The report output varies based on the filters and custom data selections applied before generating the report. The three common scenarios are described below.
Scenario 1: No Custom Data Selected
When only the core filters are applied — date range, client, program, and date type — and no custom data columns are added, the report returns a single consolidated summary row for the program. This provides a straightforward, high-level view of overall program performance without any dimensional breakdown.
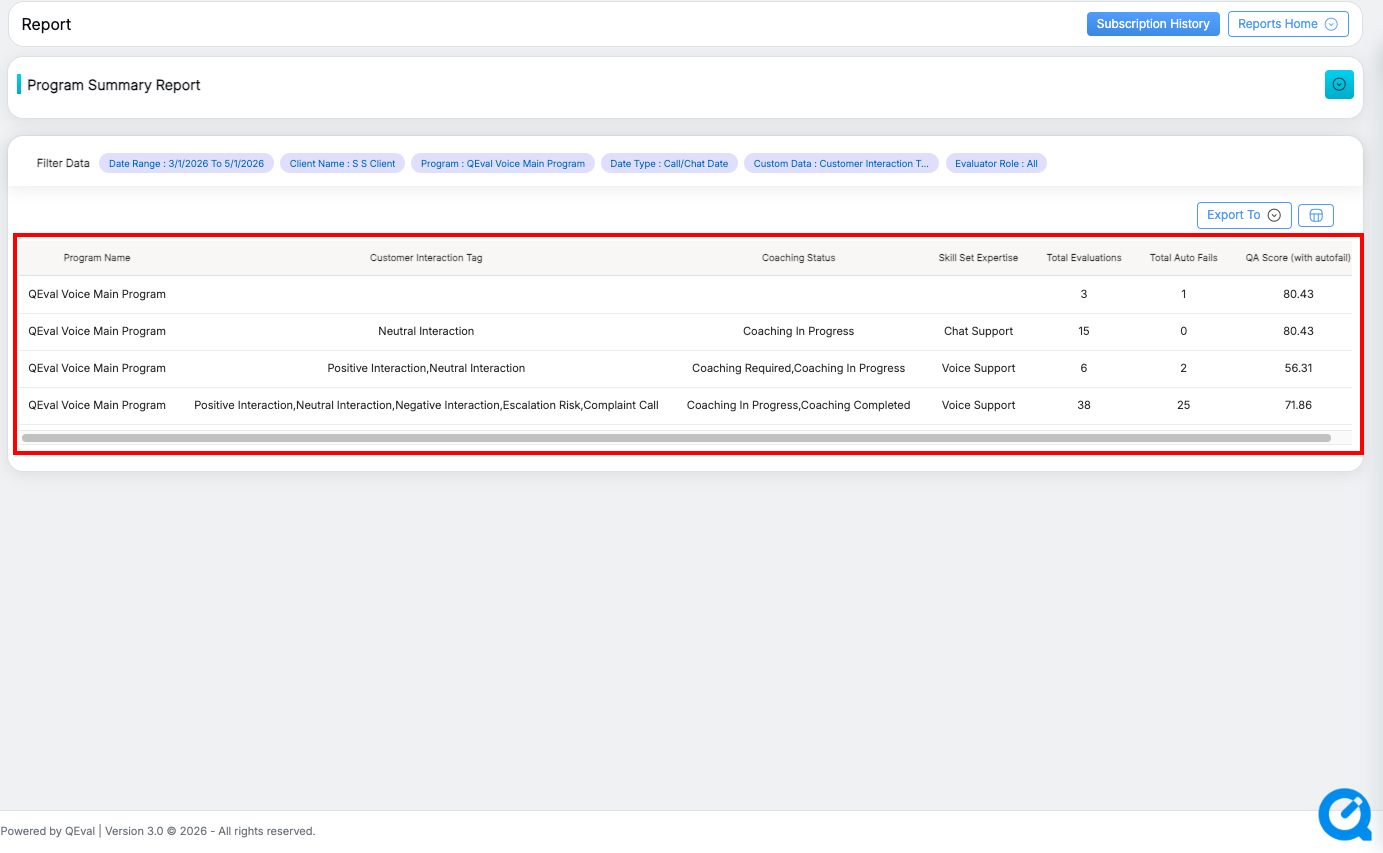
Scenario 2: Custom Data Selected, No Field-Level Filters Applied
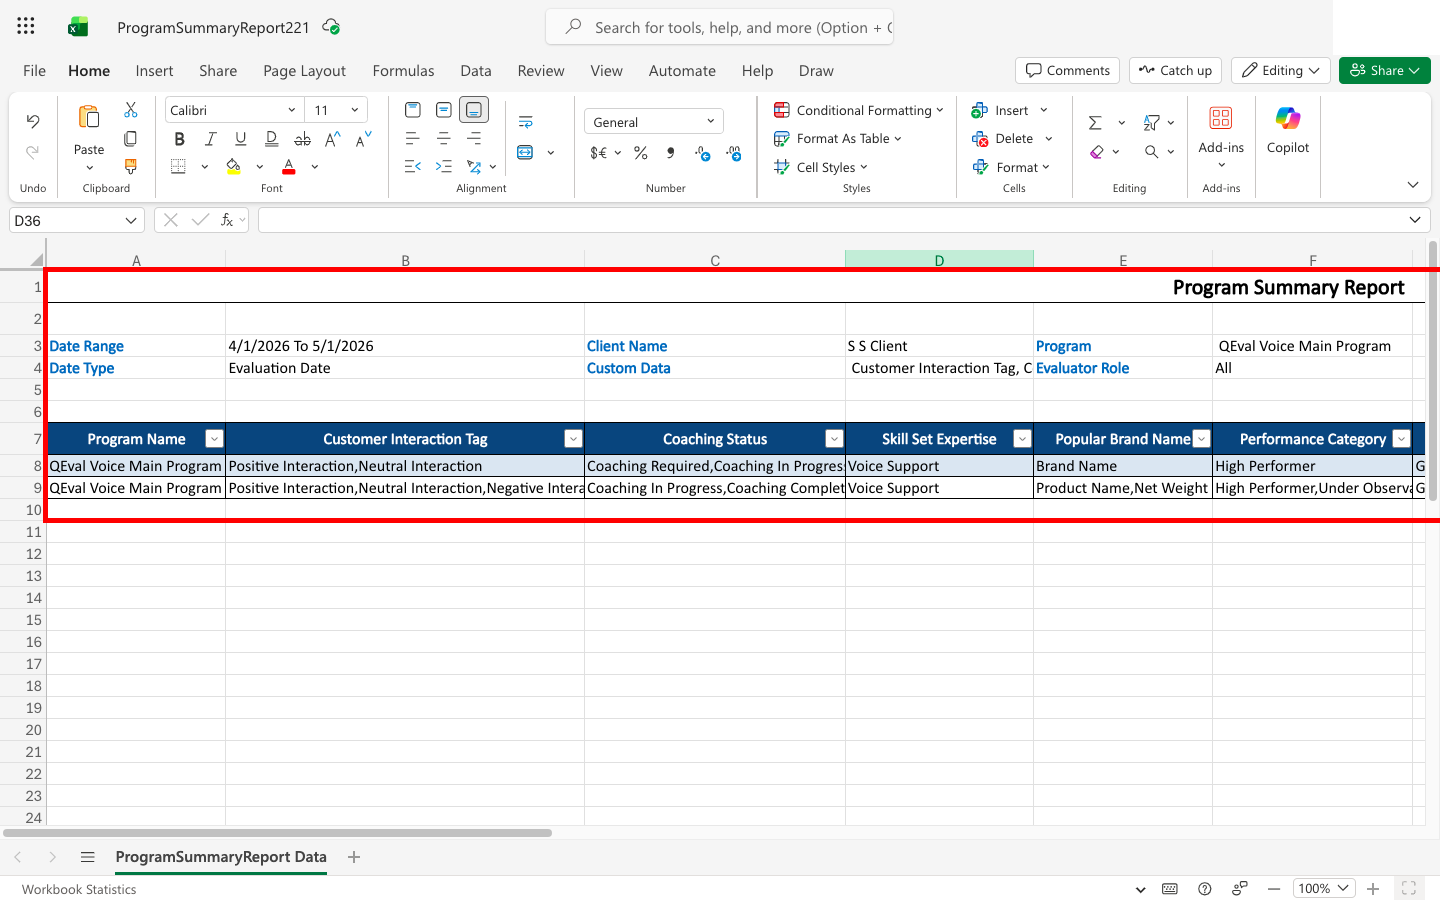
When custom data columns are added — such as Customer Interaction Tag, Coaching Status, and Skill Set Expertise — the report expands into multiple rows. Each row represents a unique combination of those custom data values as they appear across the evaluation data. This allows users to compare performance across different interaction types, coaching stages, or skill categories without restricting the data to specific values.
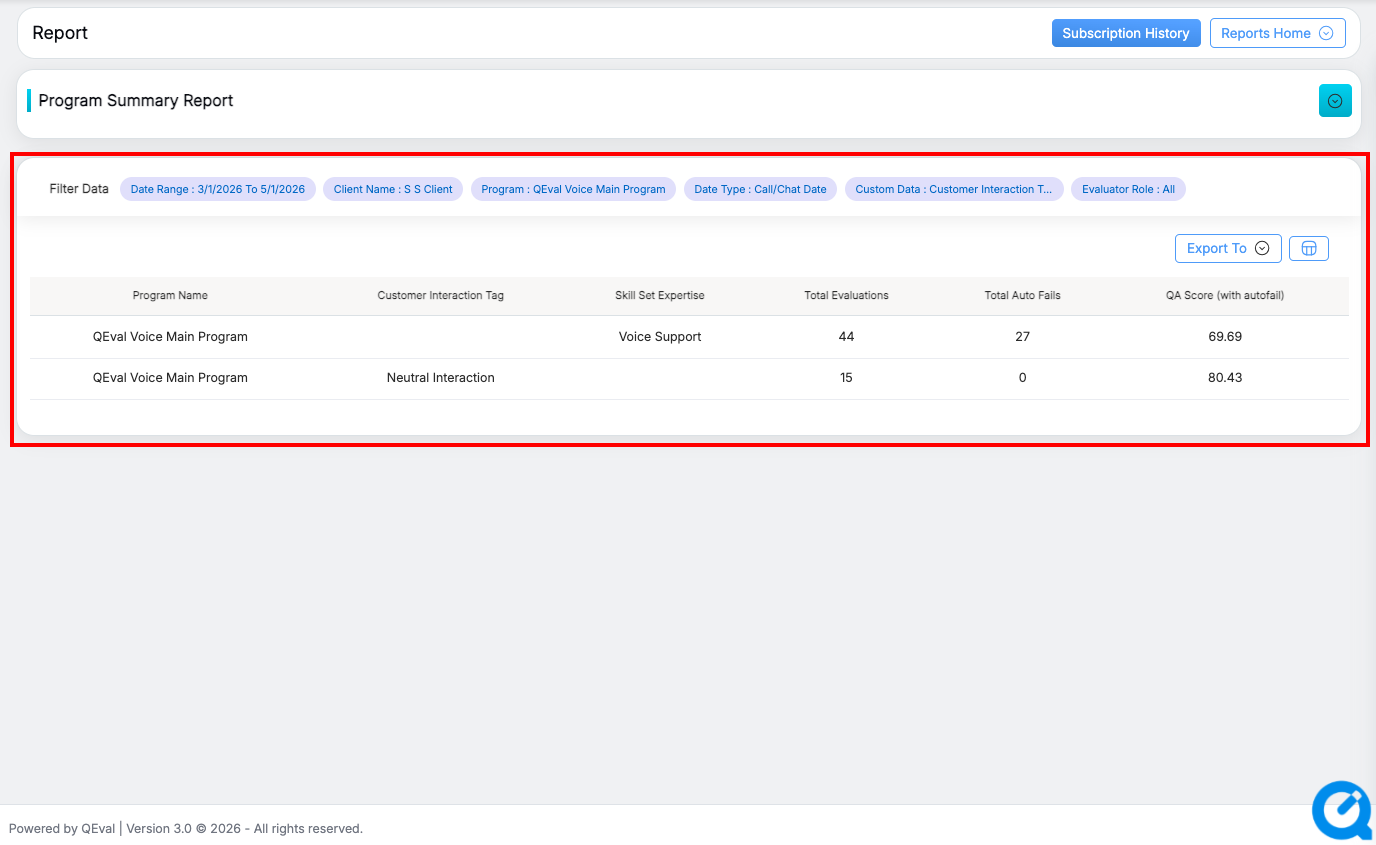
Scenario 3: Custom Data Selected and Field-Level Filters Applied
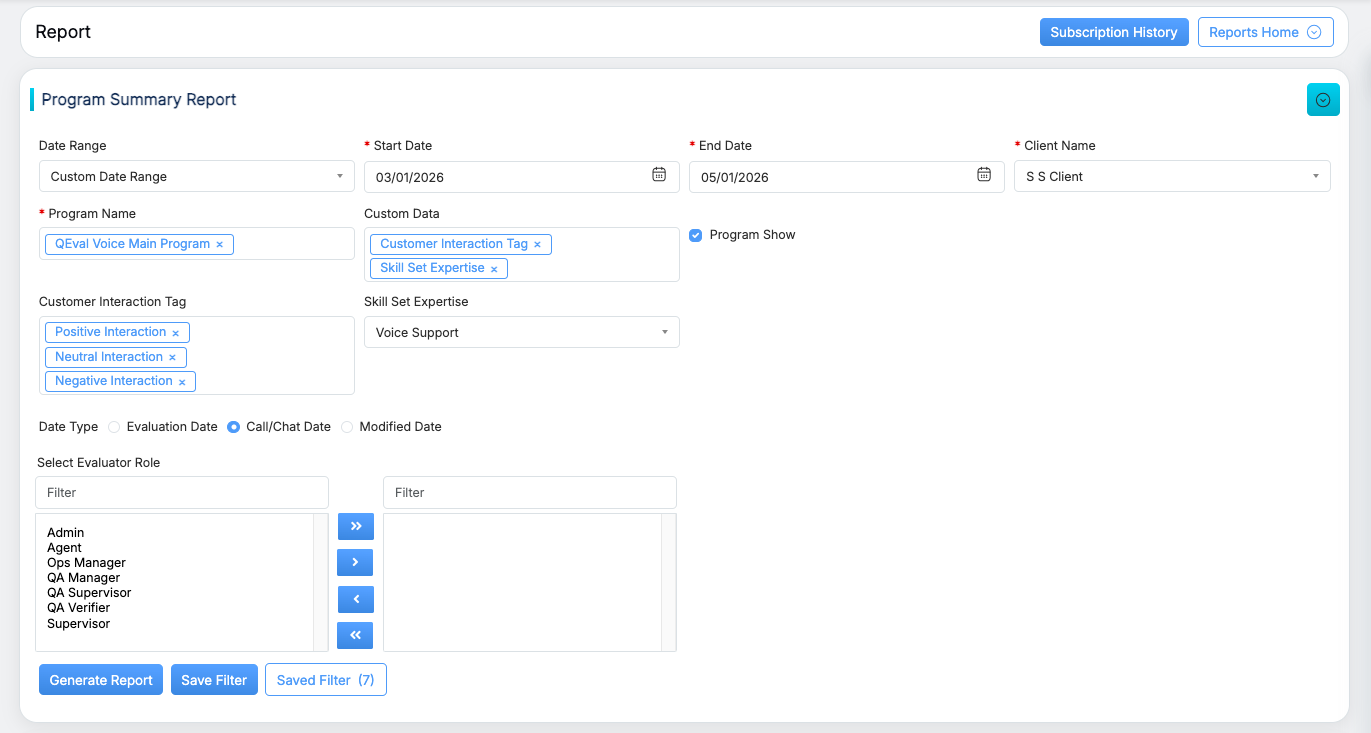
When custom data columns are selected and specific values are also chosen within the filter fields that appear beneath them, the report narrows further. Only evaluations that match the selected field-level values are included in the results. This is useful when the goal is to analyze a targeted subset of the data — for example, viewing only Voice Support evaluations tagged as Positive, Neutral, or Negative Interactions.
Note: Selecting custom data columns controls which dimensions appear in the report table. Applying field-level filters within those columns controls which data rows are included in the results. Both can be used independently or together depending on the level of detail required.
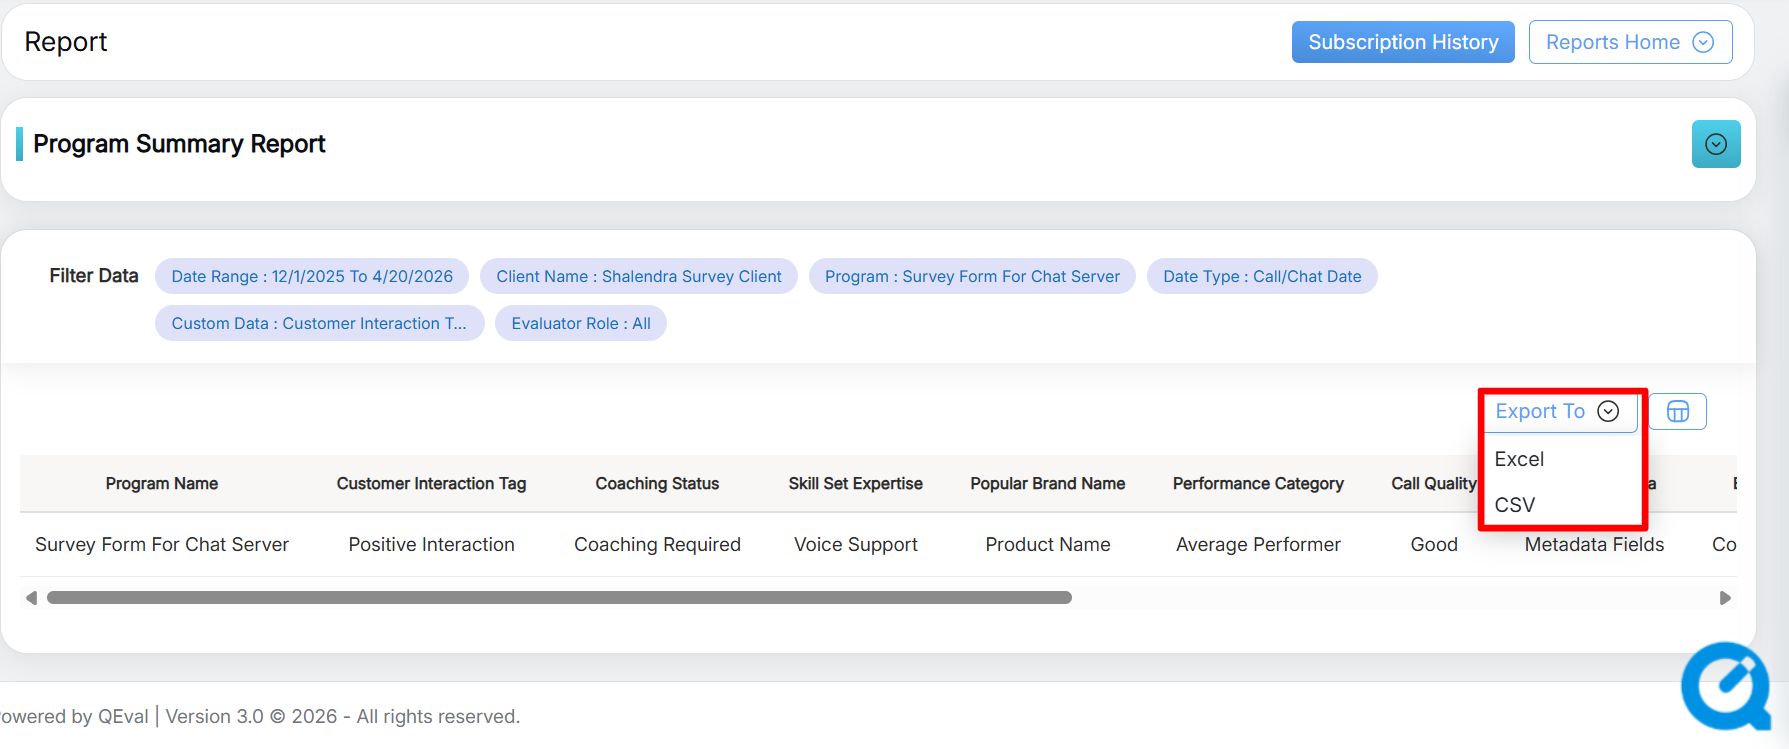
Program Summary Report Export Options
The snapshot below illustrates how the exported Excel file appears when Custom Data and Custom Data Filter options are applied.
Video